



This Week’s Trade Exits
As soon as I exit a trade, I note that in the comments of the post where I first mentioned the trade; at the end of the week, I try to track them all in one post. Starting in July, 2024, I have also been tracking them in a spreadsheet. These are the trades I exited this week.
Clicking on one of the exit cards should take you to the original alert where we mentioned the trade; exits will be documented in the comments on the dates they occurred.
Stocks or Exchange Traded Products
None.
Options


Comments
Stocks or Exchange Traded Products
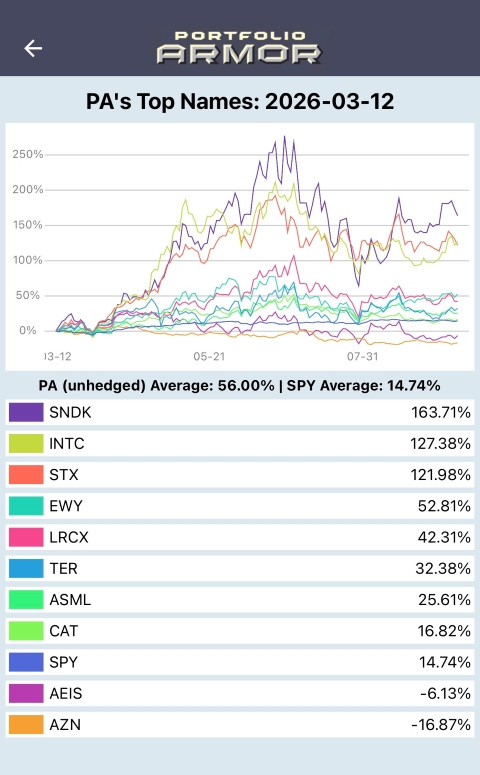
No exits this week, as I’ve focused on options instead of our basic strategy, which involves buying stocks and ETFs. Nevertheless, the performance of our Top Names remains strong, as you can see below.
Options
This was an options-expiration week, when our losing exits tend to cluster. Our pre-set exit orders usually take winning trades off earlier, leaving a disproportionate share of positions that haven’t reached their targets to be resolved at expiration. This week illustrated that pattern: alongside ten profitable partial exits, 19 completed options trades closed, with three winners and 16 losers, for an average return of about −57.5% on maximum risk. It was our weakest OpEx batch of 2026 so far by both average return and win rate.
Because that result was an outlier, I looked more closely at what drove it, particularly in light of the process improvements we described in Sharpening The Saw.

All 19 trades were entered before we published that post on August 25th, and 18 were entered by the end of May. Fifteen of the 16 losing trades also predated our current 50-day EMA (Exponential Moving Average) entry rule. Looking back, only three of those 15 were below their 50-day EMAs when we entered them, so that rule would have helped at the margin but wouldn’t have prevented most of these losses. Many of the positions were opened before the summer pullbacks, after strong moves in the themes we were trading.
Our weekly runner process probably would have made a larger difference in a few cases. LUNR and CRMD—and possibly BCRX—gave us opportunities to monetize their long calls after their short legs had been resolved. That process couldn’t have rescued the deeply out-of-the-money calls or capped spreads in the batch, but it could have materially improved a few results. Early evidence from the newer process has been better: the 15 trades completed between August 25th and this OpEx week included eight winners and averaged about +19.2% on maximum risk, though that sample remains too small for firm conclusions.
Concentration And The Risk/Return Tradeoff
The broader vulnerability is concentration risk. Portfolio Armor’s Top Names, our Market Watchers, and the Multibaggers we follow often cluster around the same sectors or investment themes. We already use the ChartMill Setup Rating and our preferred RSI band to screen out overextended entries. Even with those gates, several valid signals can reverse together when leadership rotates or a previously strong theme sells off. That risk is inherent in an approach designed to concentrate capital in our strongest ideas.
Risk-averse investors can address that differently through Portfolio Armor’s hedged-portfolio method. It also concentrates on securities with the highest expected returns, but it strictly limits potential downside according to the investor’s selected threshold, as described in the post below.

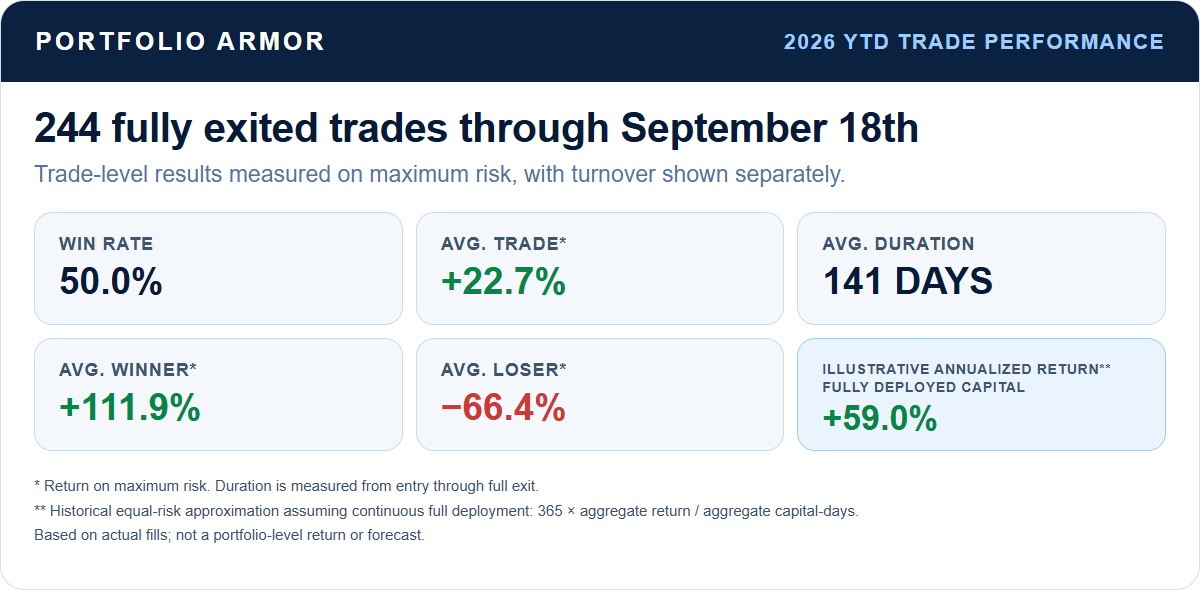
Historically, our trading approach has offered considerably more return potential. This year’s completed trades have averaged +22.74% over 140.8 calendar days, equivalent to an illustrative annualized rate of about 59% if equal-risk capital were continuously redeployed. By comparison, the portfolios hedged against greater-than-20% through greater-than-40% declines on our performance page have averaged 8.72% to 10.88% over six months, or about 17.4% to 21.8% annualized. This isn’t an apples-to-apples comparison: the trading figure is a trade-level, continuously deployed-capital illustration, while the hedged figures are actual portfolio returns net of hedging and trading costs. Still, it illustrates the tradeoff. If the historical relationship persists, the trading approach should offer higher returns in exchange for greater dispersion and concentration risk, while the hedged-portfolio method offers a more controlled path.
We also continued entering new trades during the downturn whenever stocks passed our screens. Those positions generally start from lower prices and have later expirations, so performance may improve as that newer cohort matures. We’ll keep comparing the post-improvement cohorts with the earlier ones and looking for evidence-based ways to sharpen the process. For now, the clearest course is to apply our existing entry gates and weekly runner reviews consistently instead of adding a new entry restriction in response to one unusually bad OpEx batch.