



Our Year-To-Date Performance
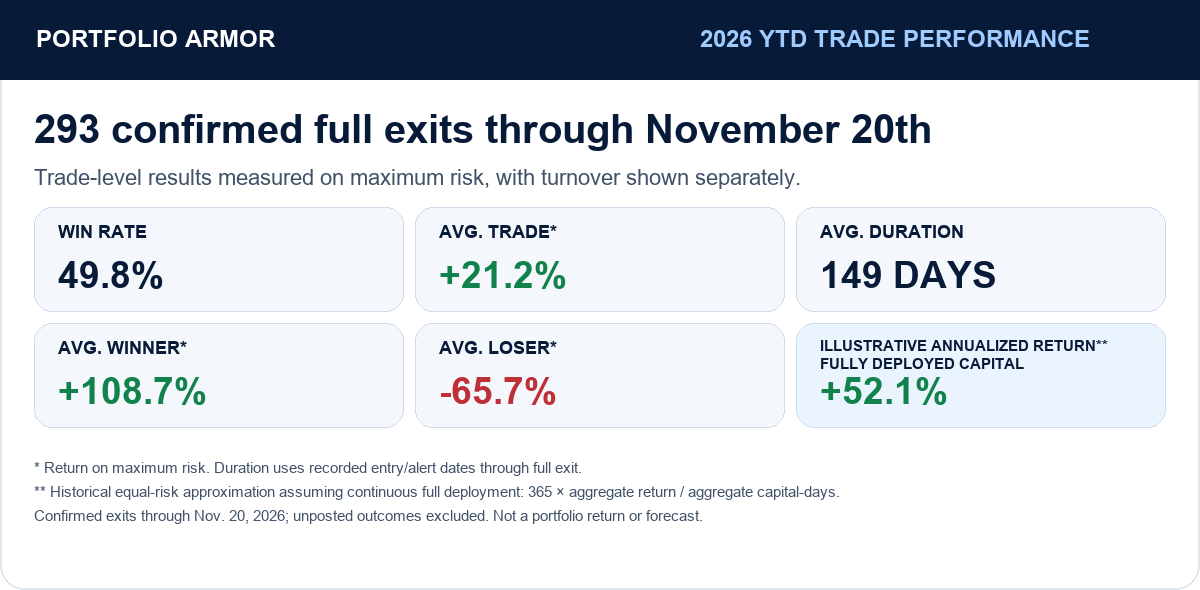
Our year-to-date trade performance through November 20th appears below.

This Week’s Trade Exits
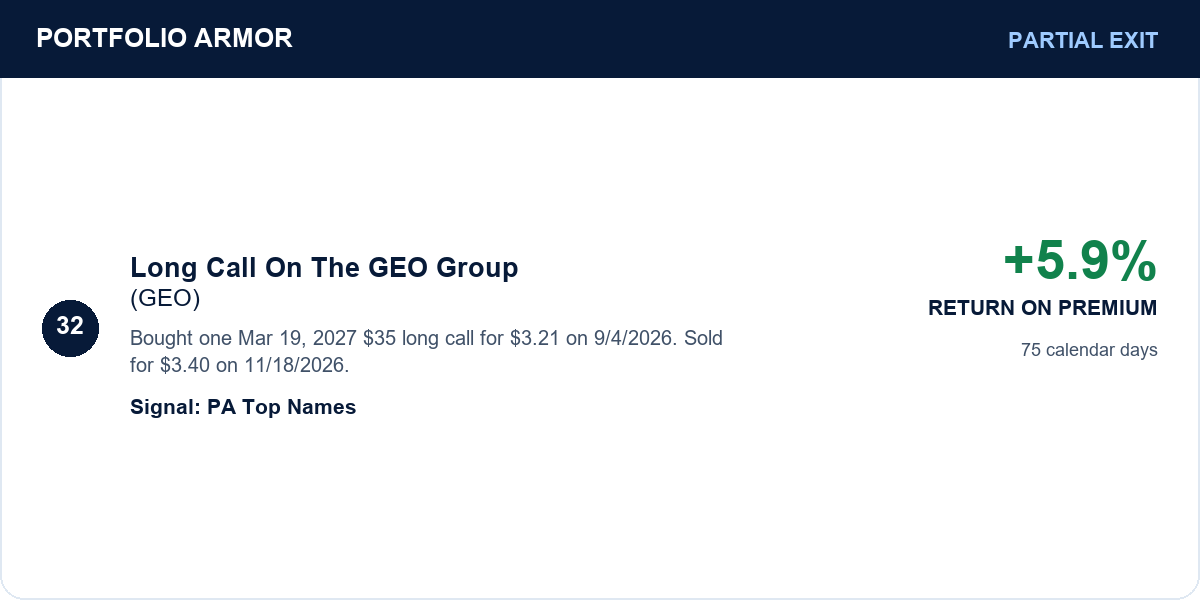
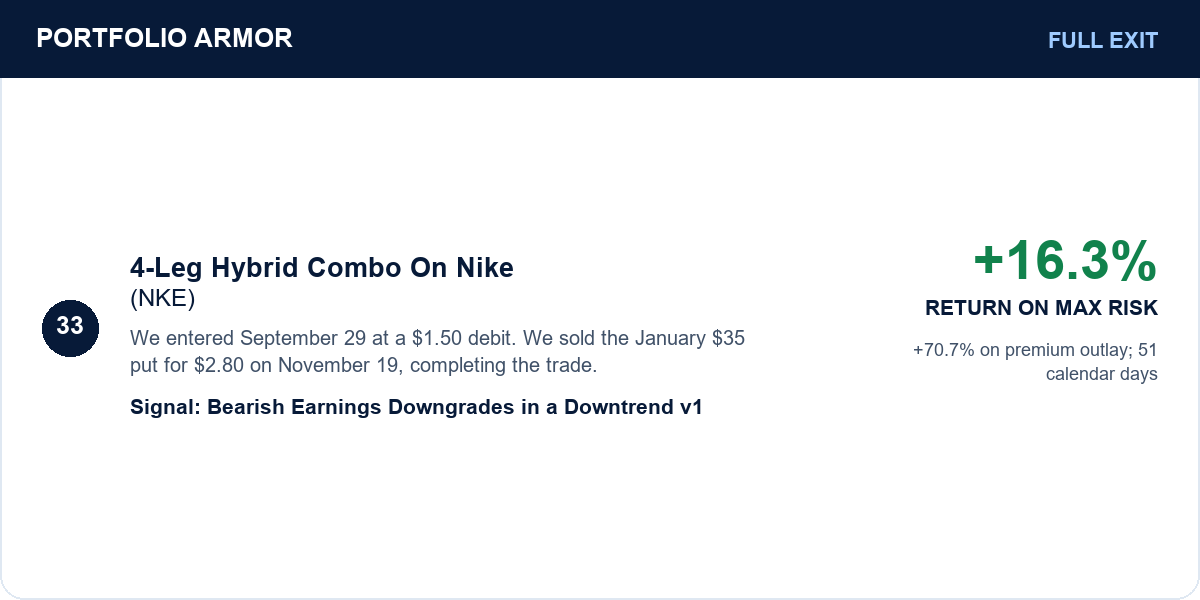
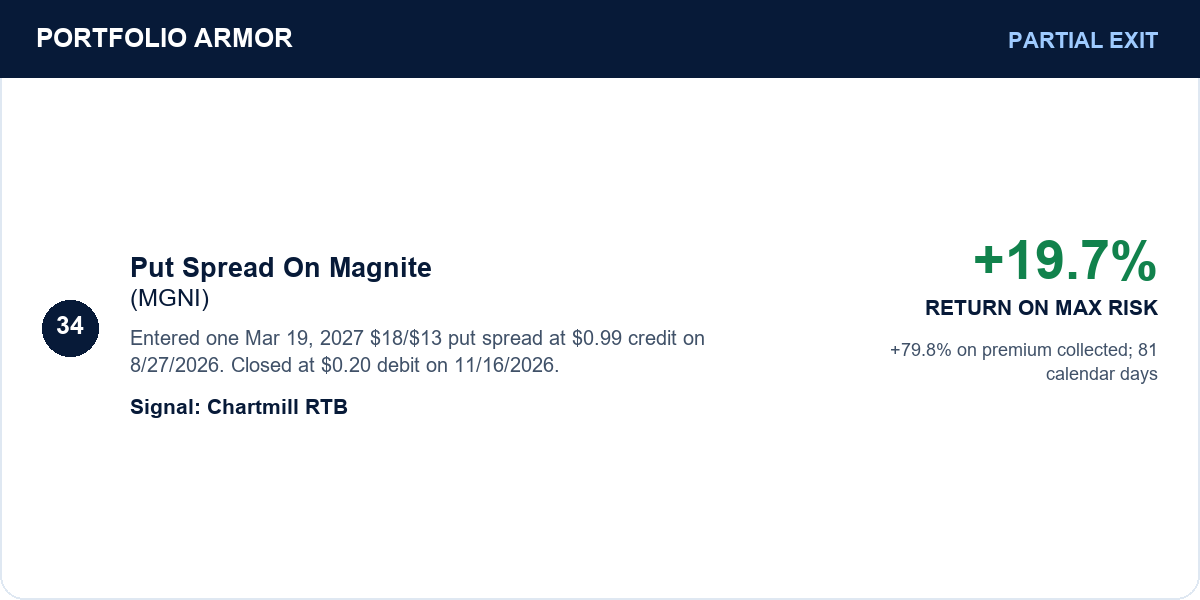
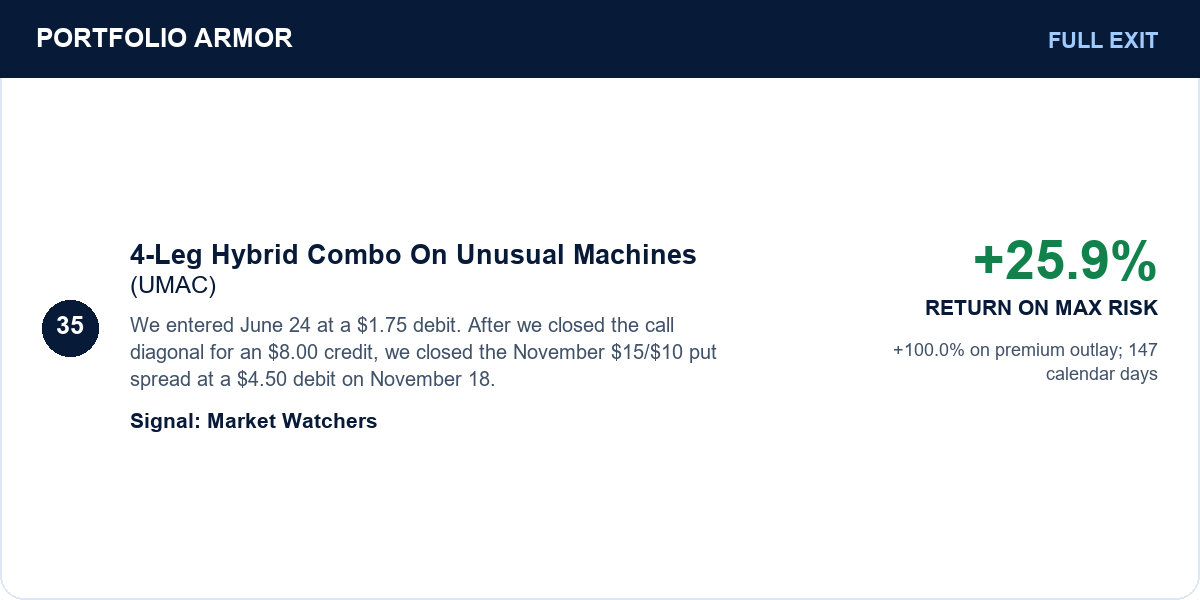
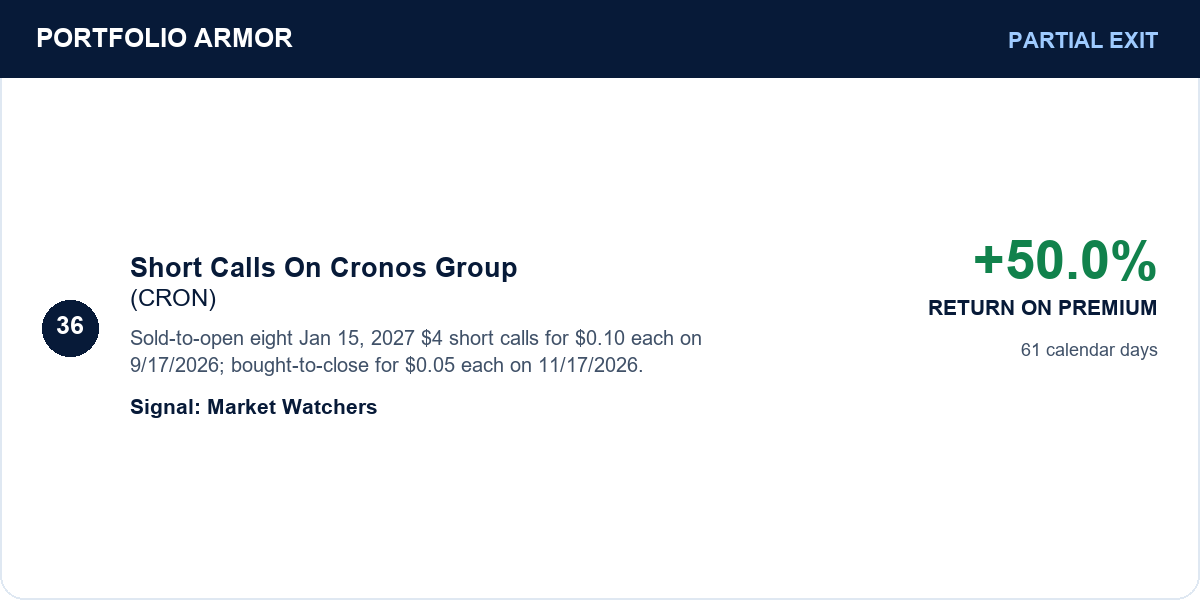
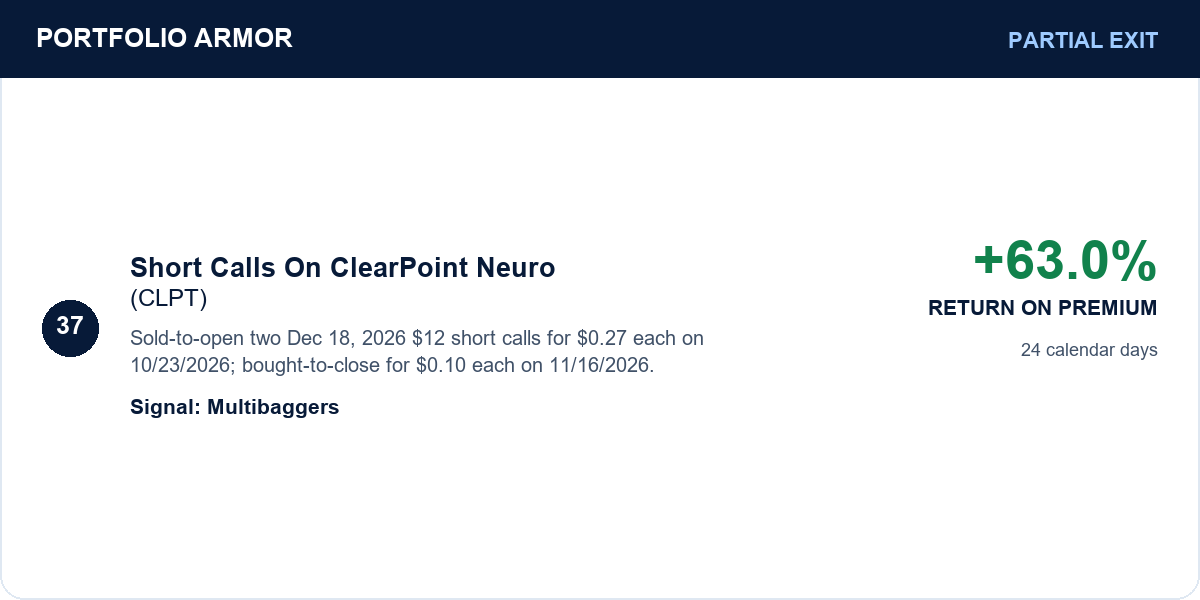
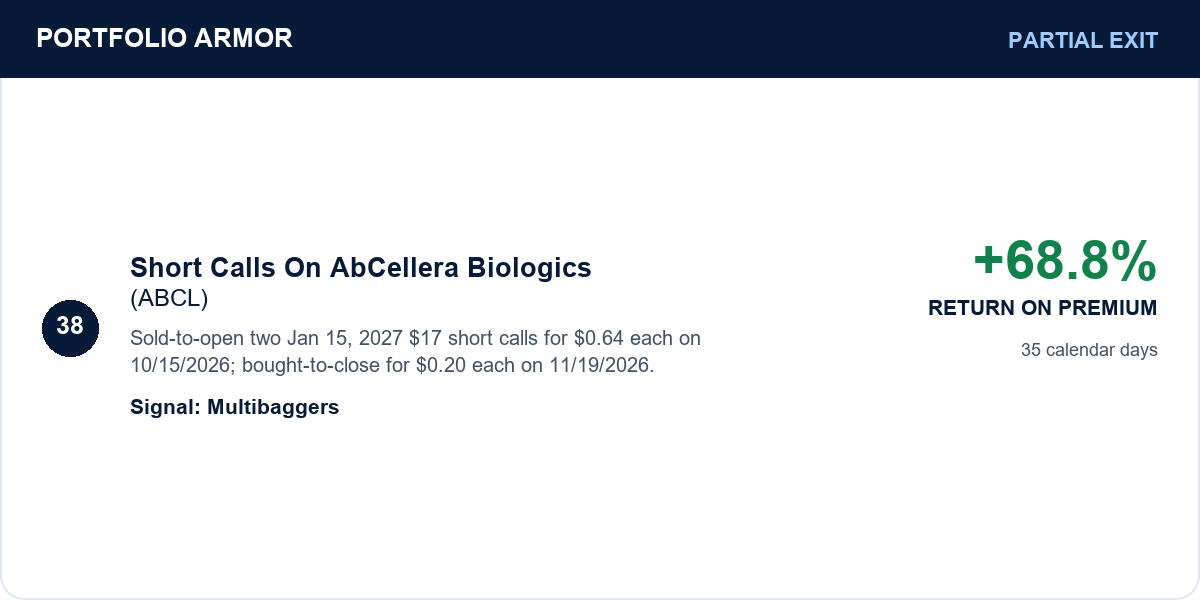
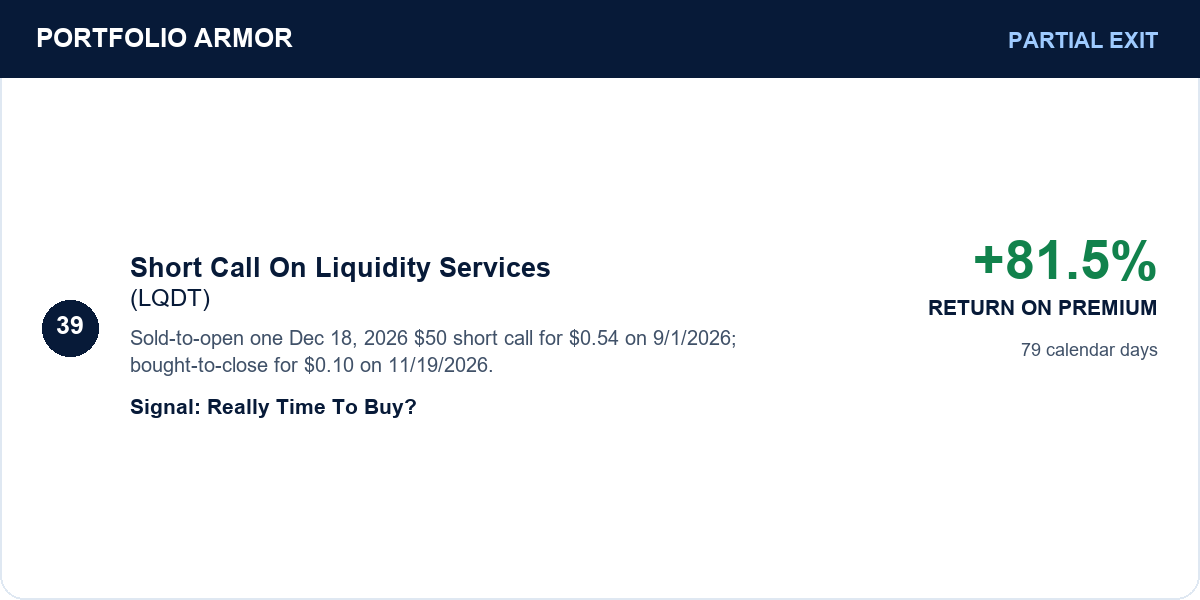
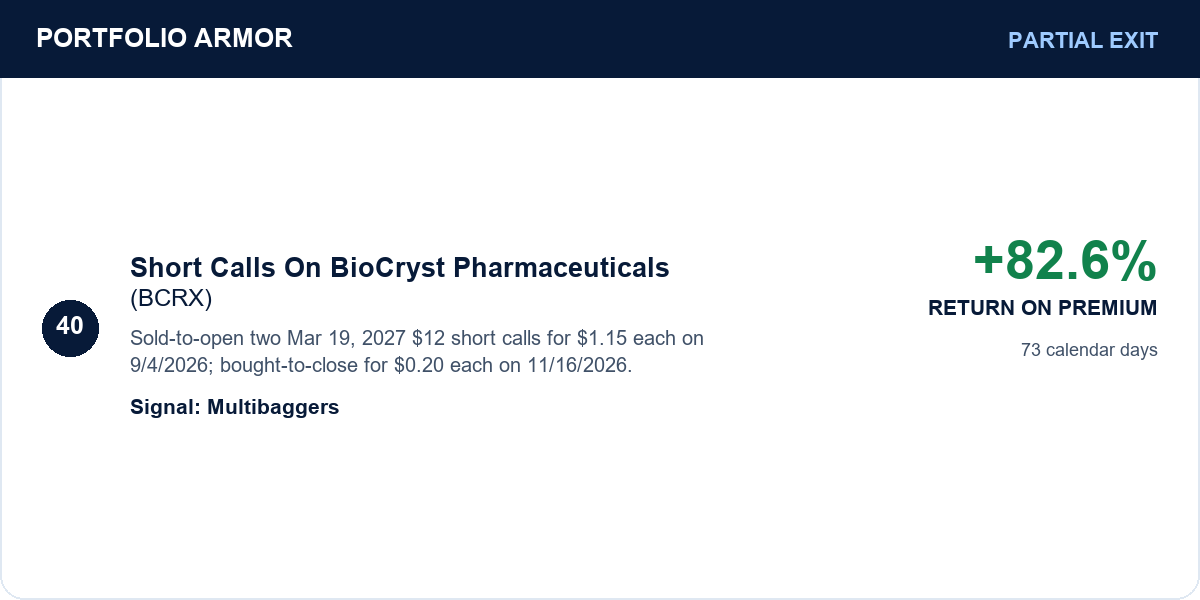
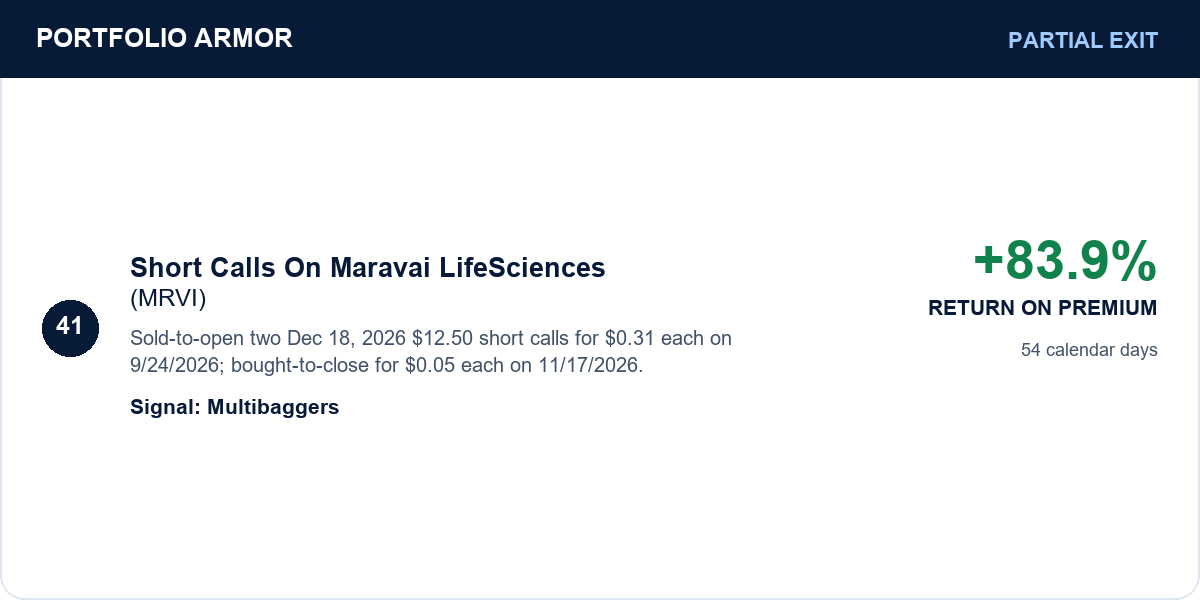
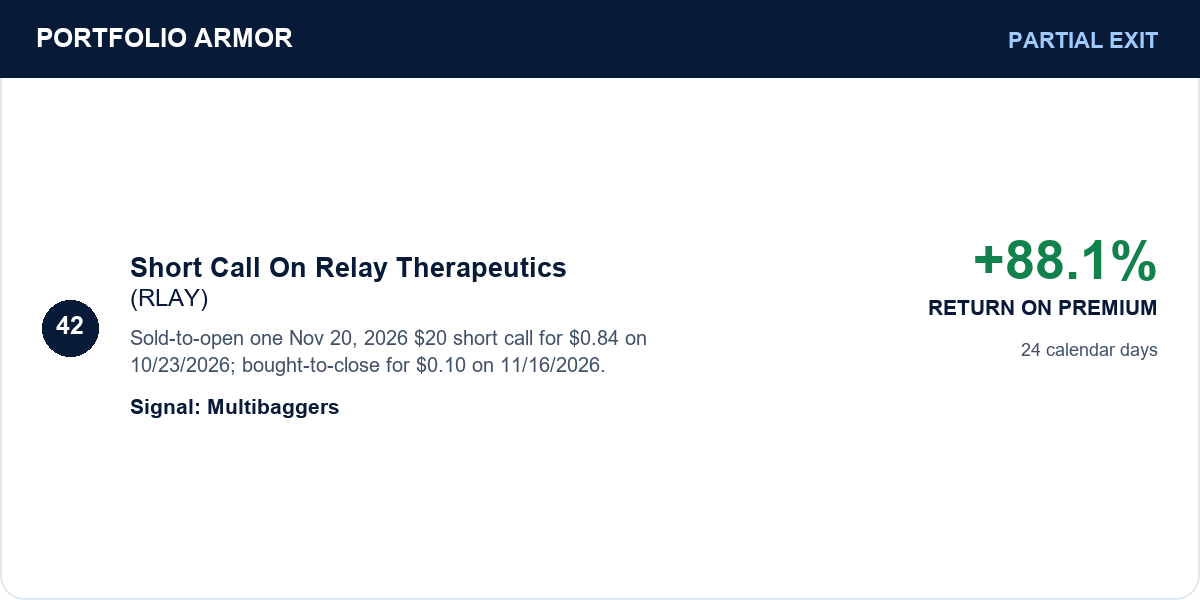
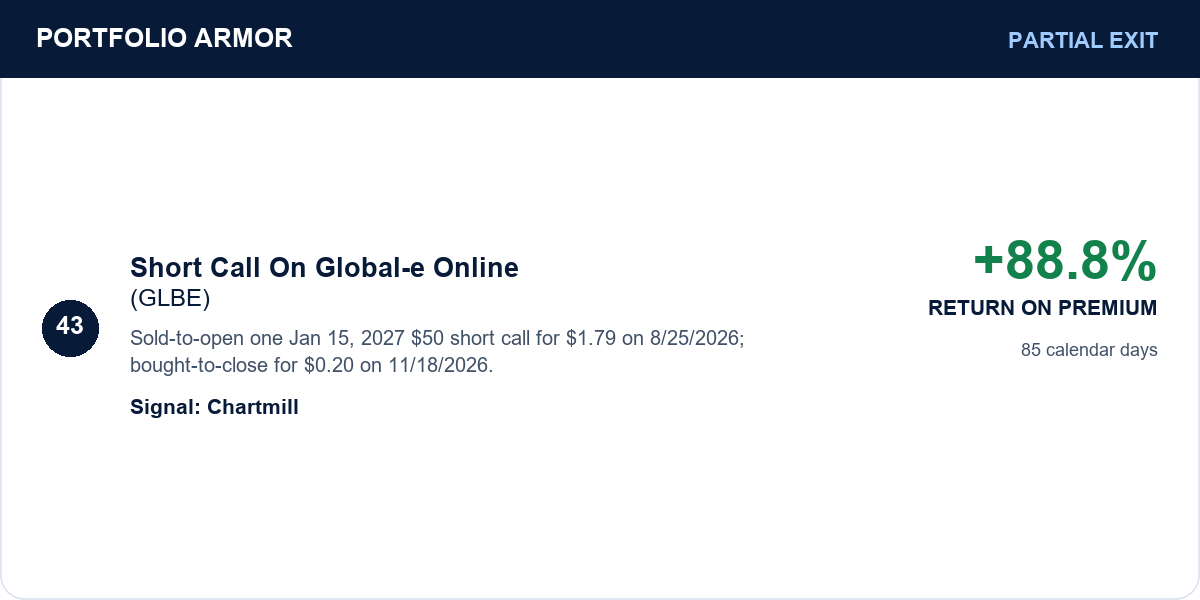
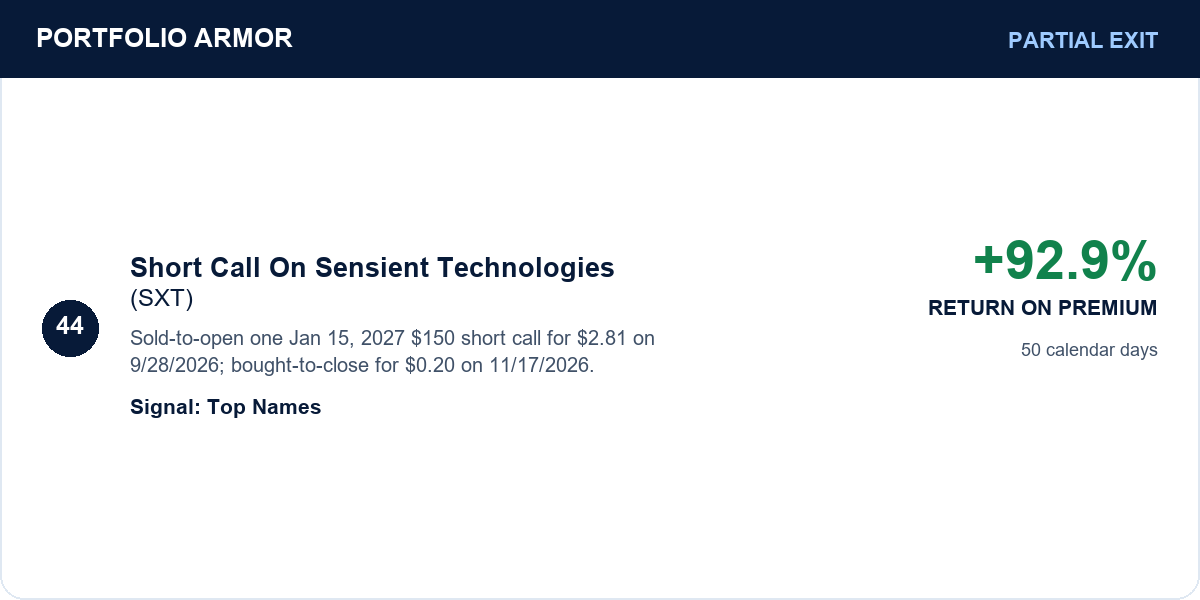
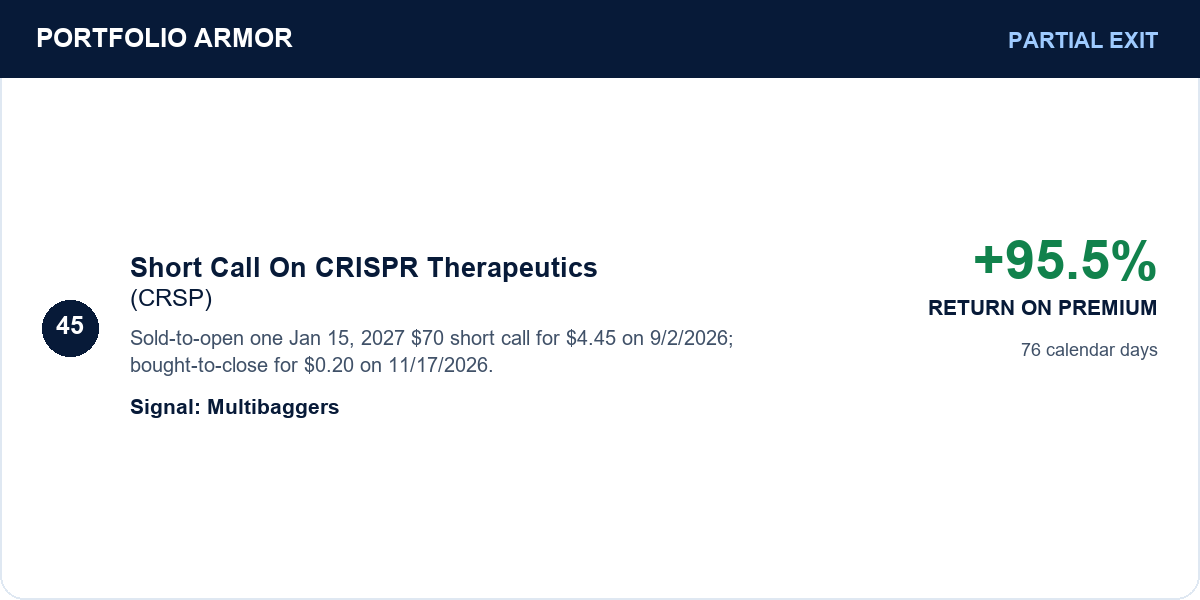
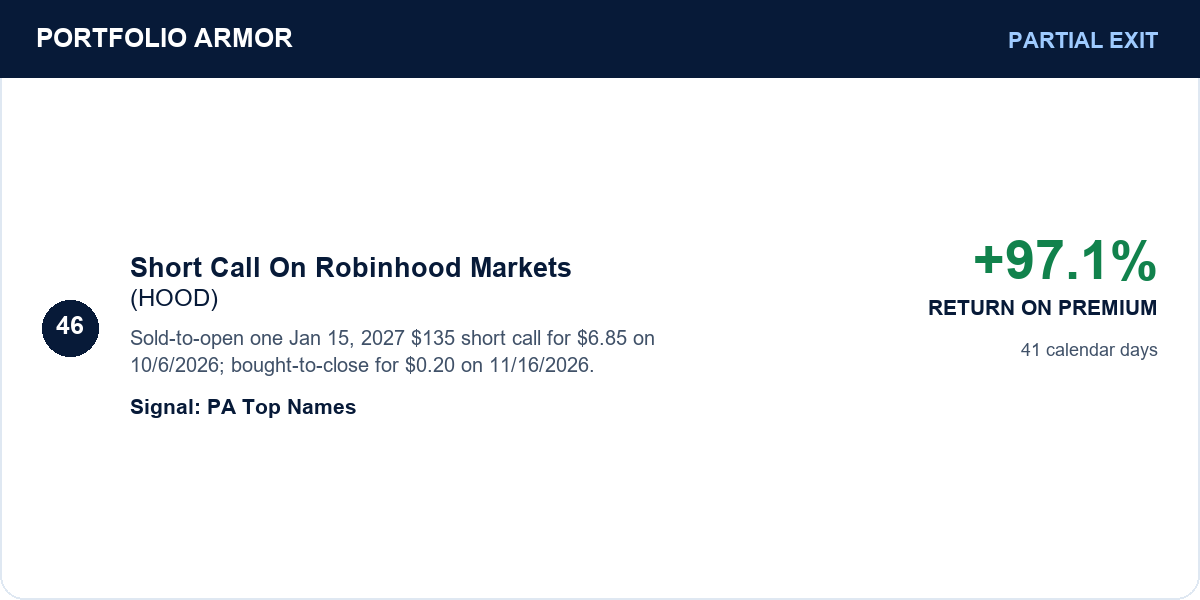
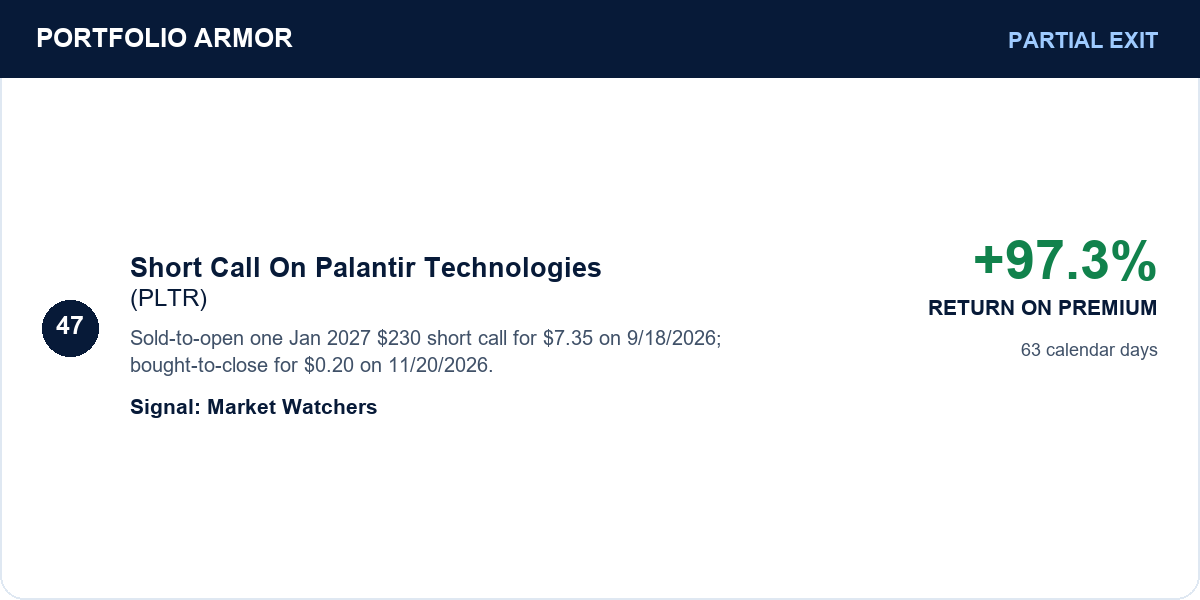
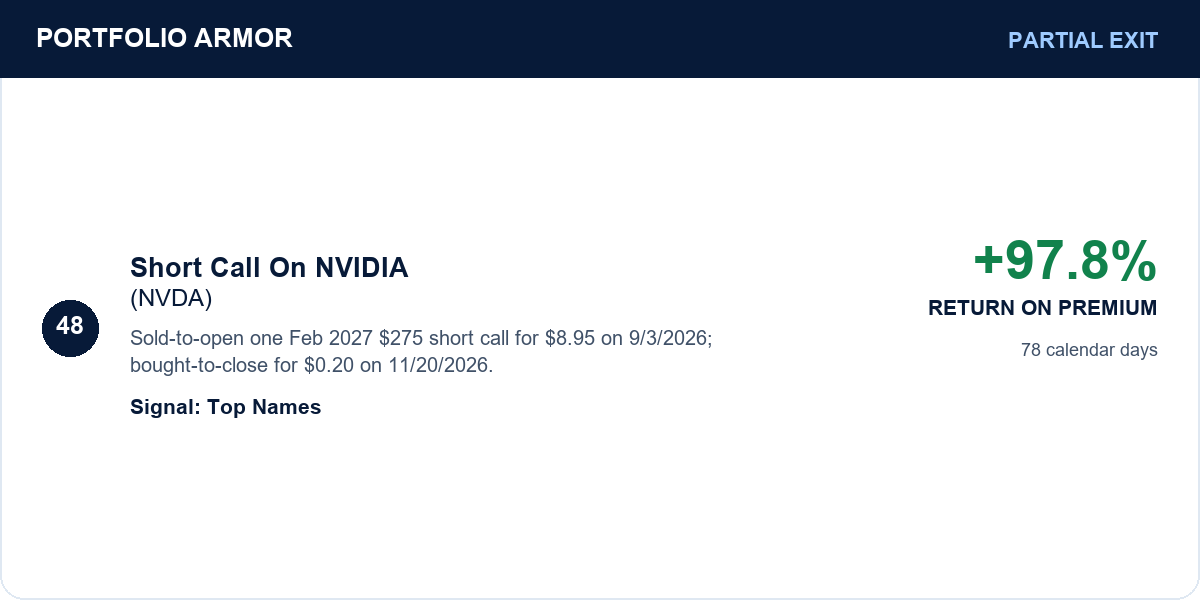
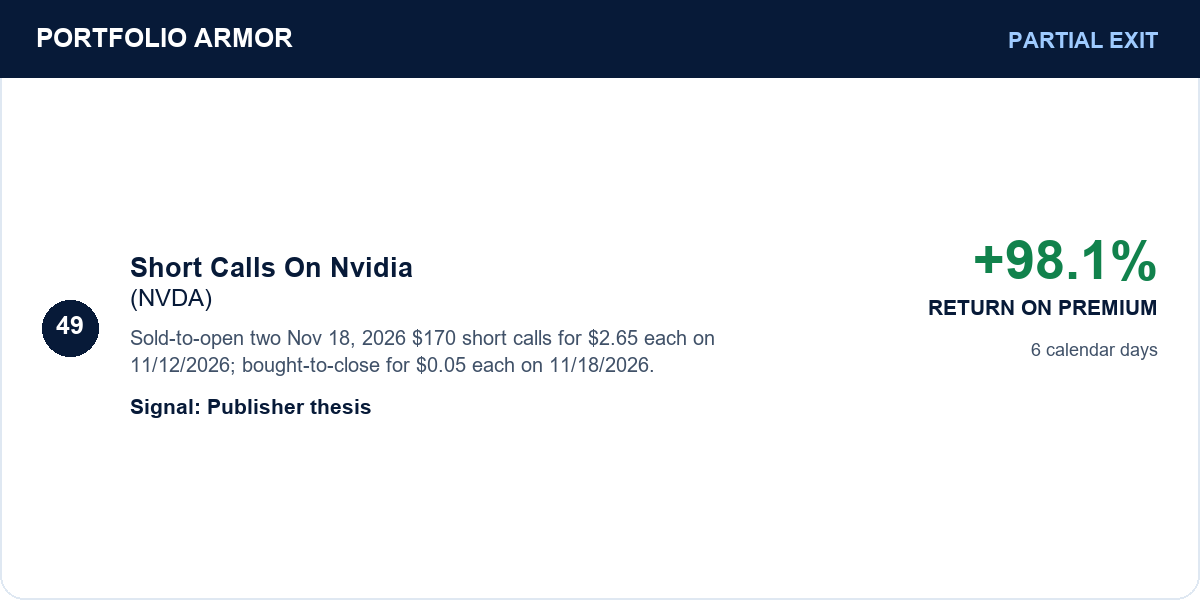
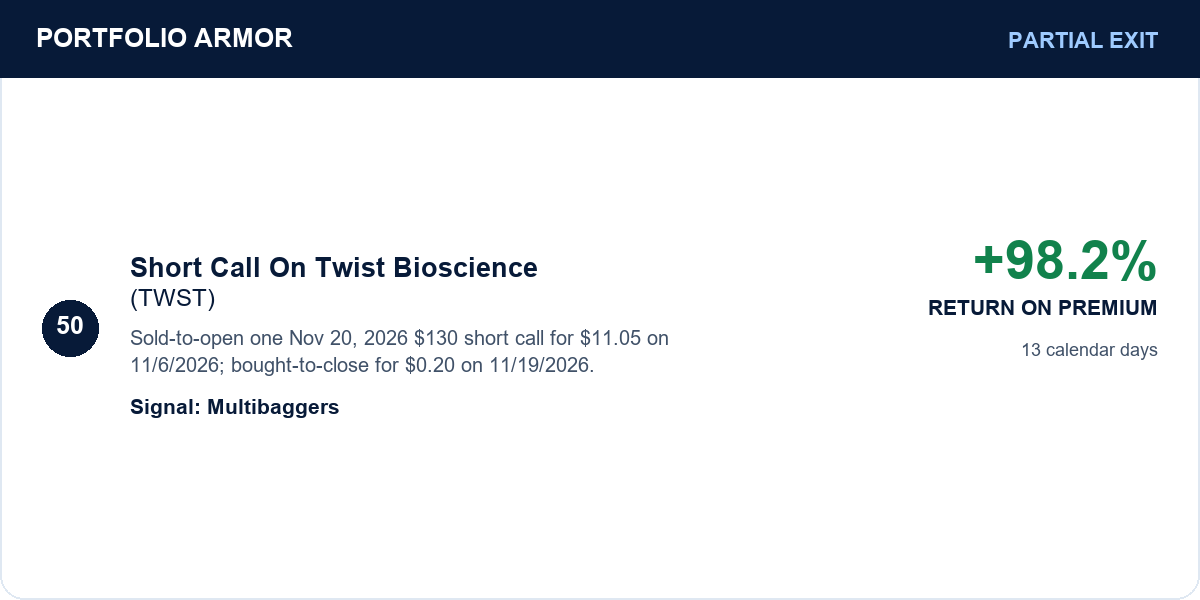
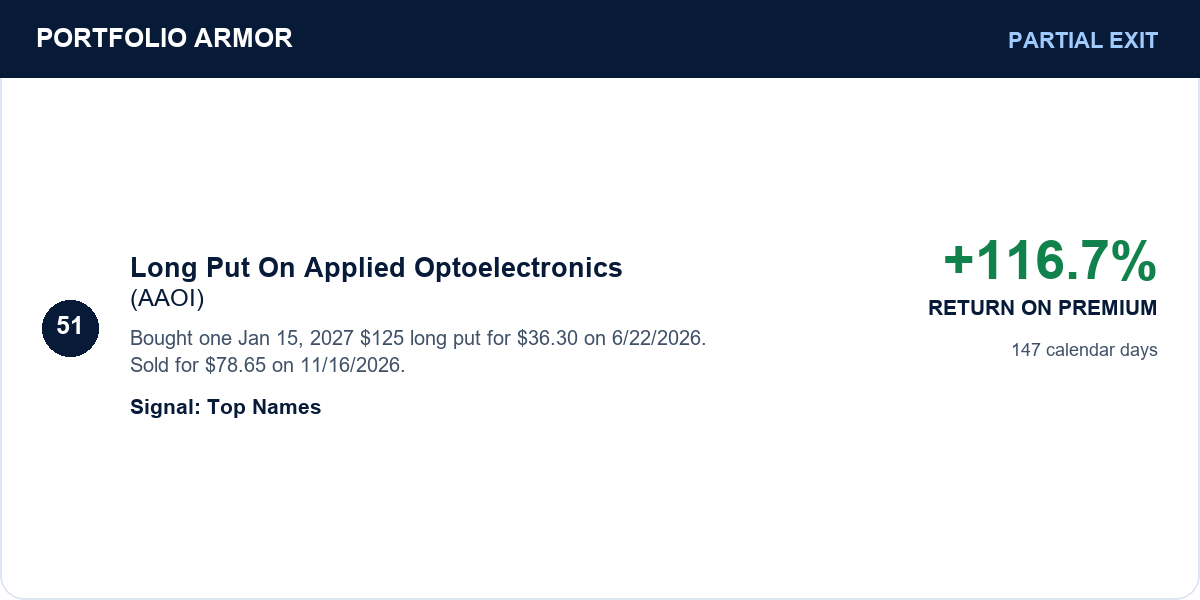
As soon as I exit a trade, I note that in the comments of the post where I first mentioned the trade; at the end of the week, I try to track them all in one post. Starting in July, 2024, I have also been tracking them in a spreadsheet. These are the exits I’ve recorded through Friday’s close.
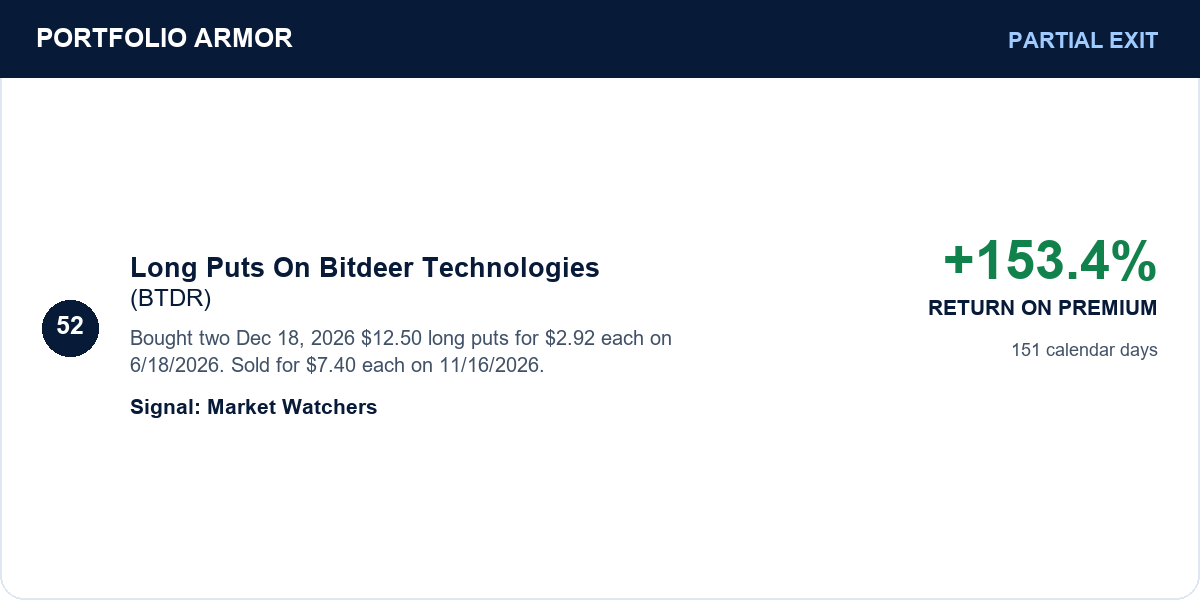
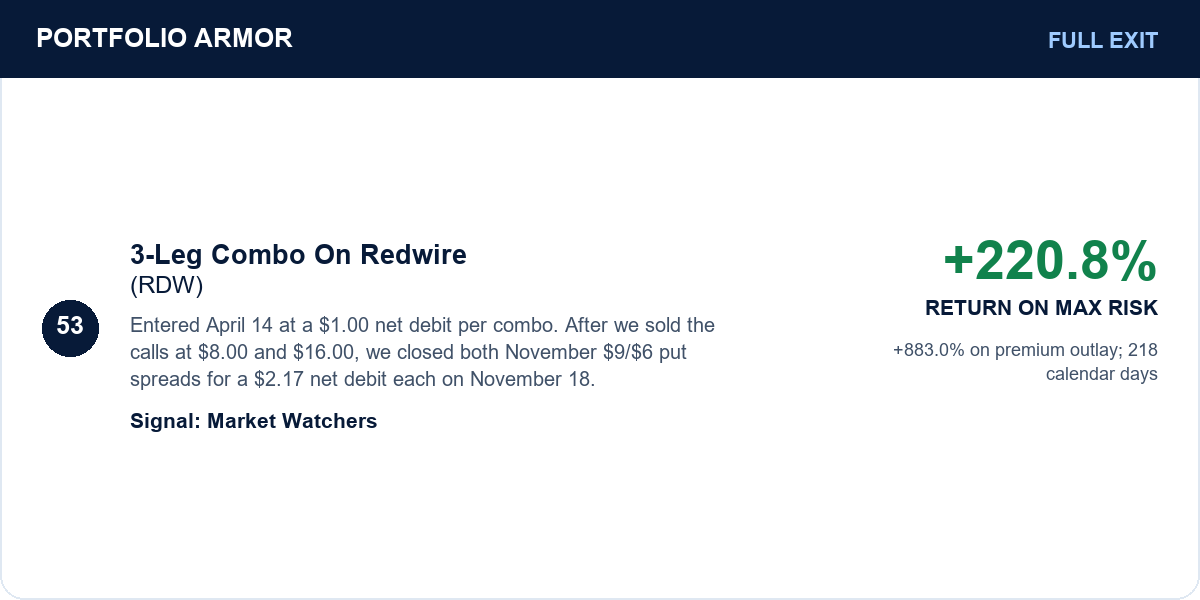
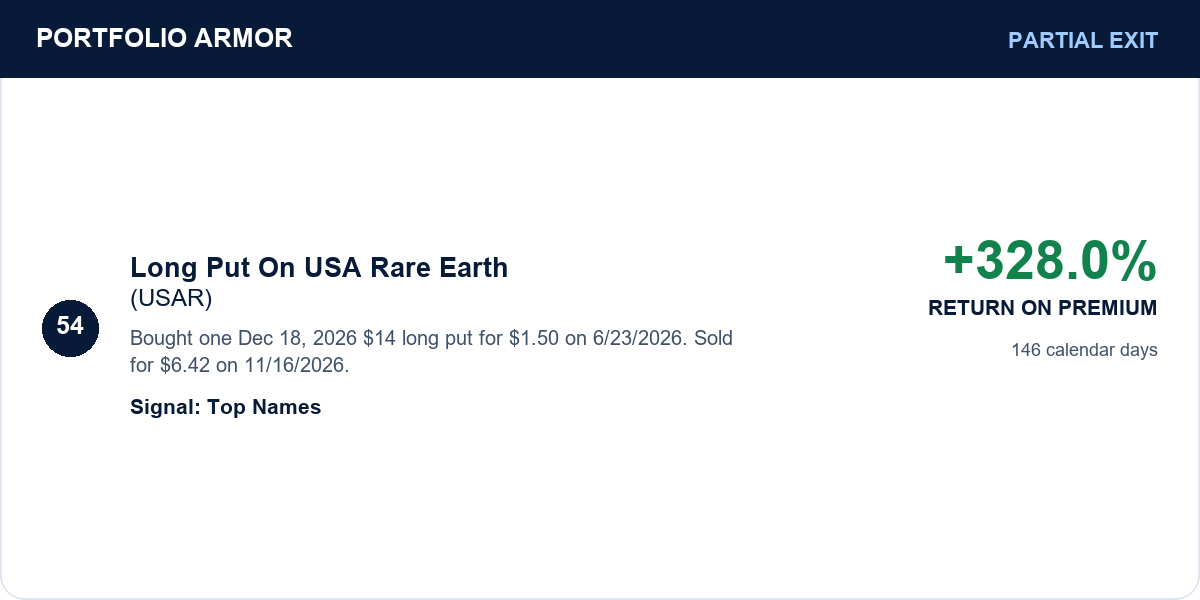
Each exit card links to its original trade alert.
Stocks or Exchange Traded Products
None
Options


Comments
Stocks and exchange-traded products
No exits in underlying securities this week, but you can see the updated performance of our system’s Top Names in this week’s Top Names post.

Options
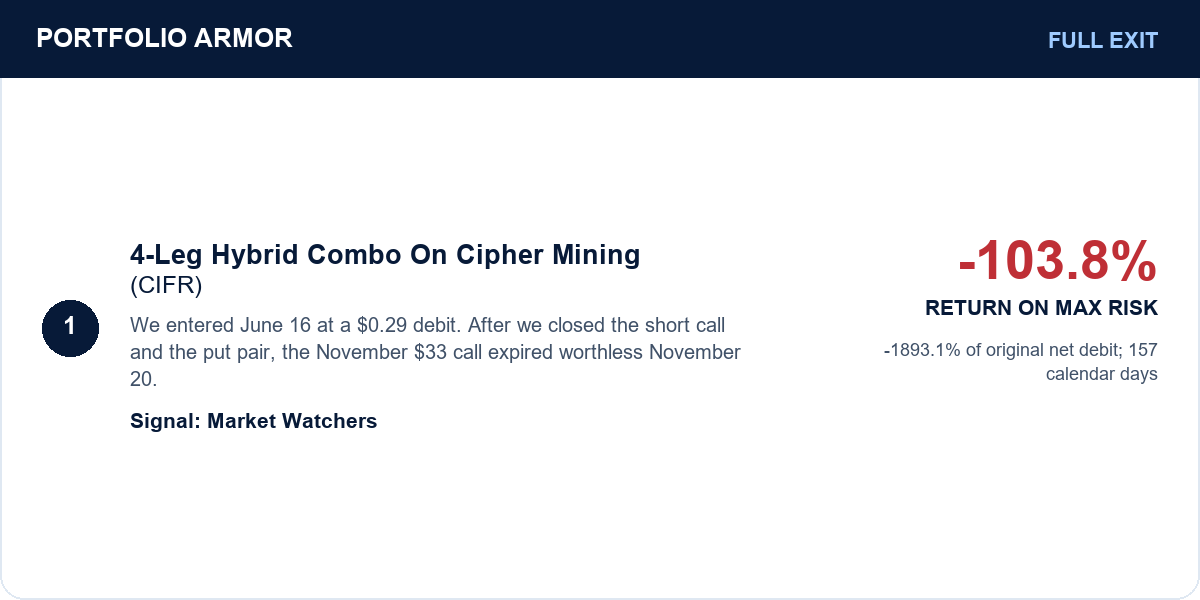
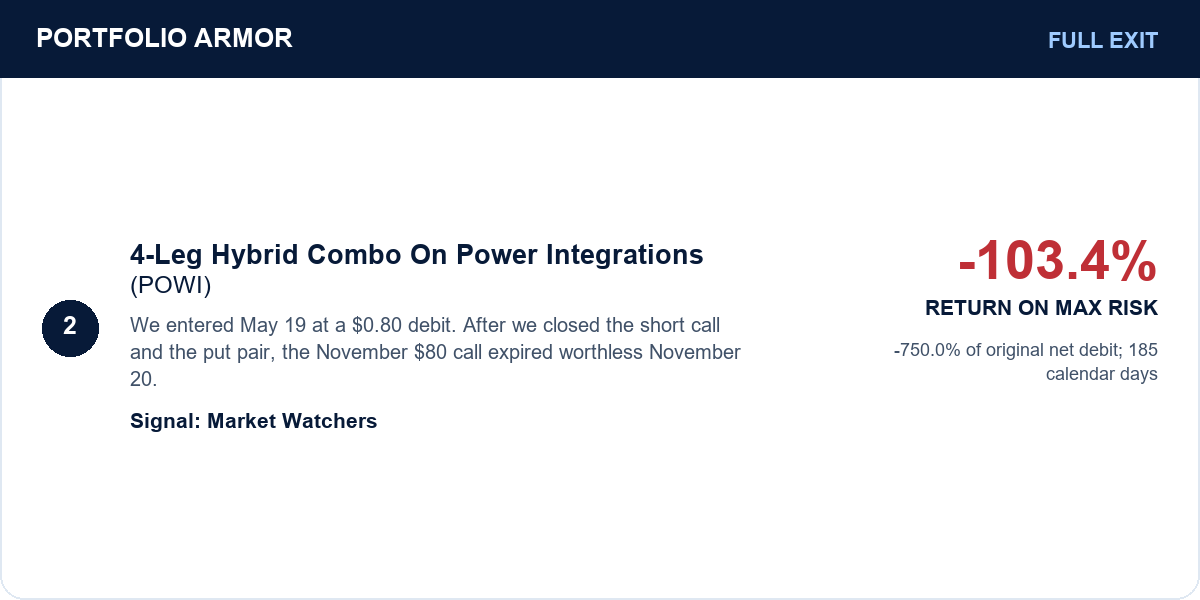
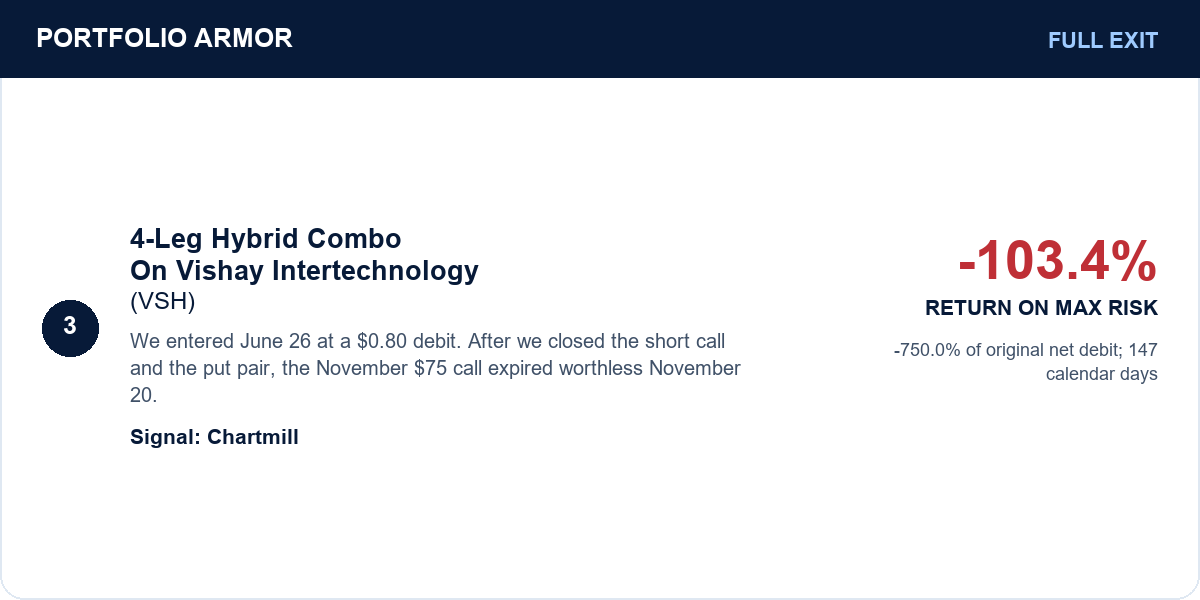
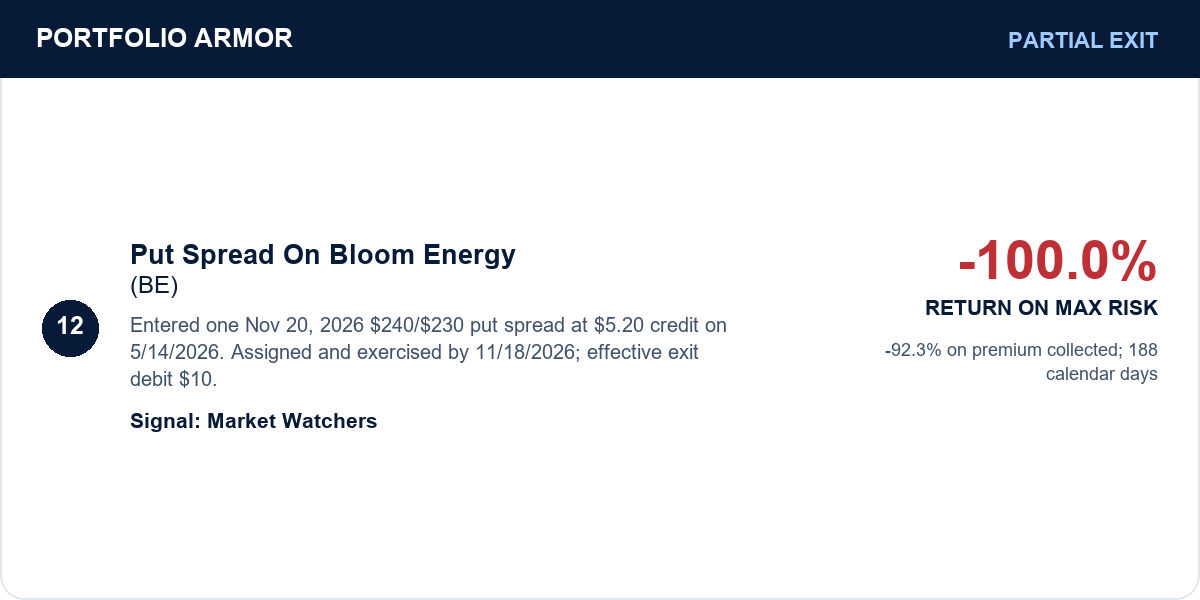
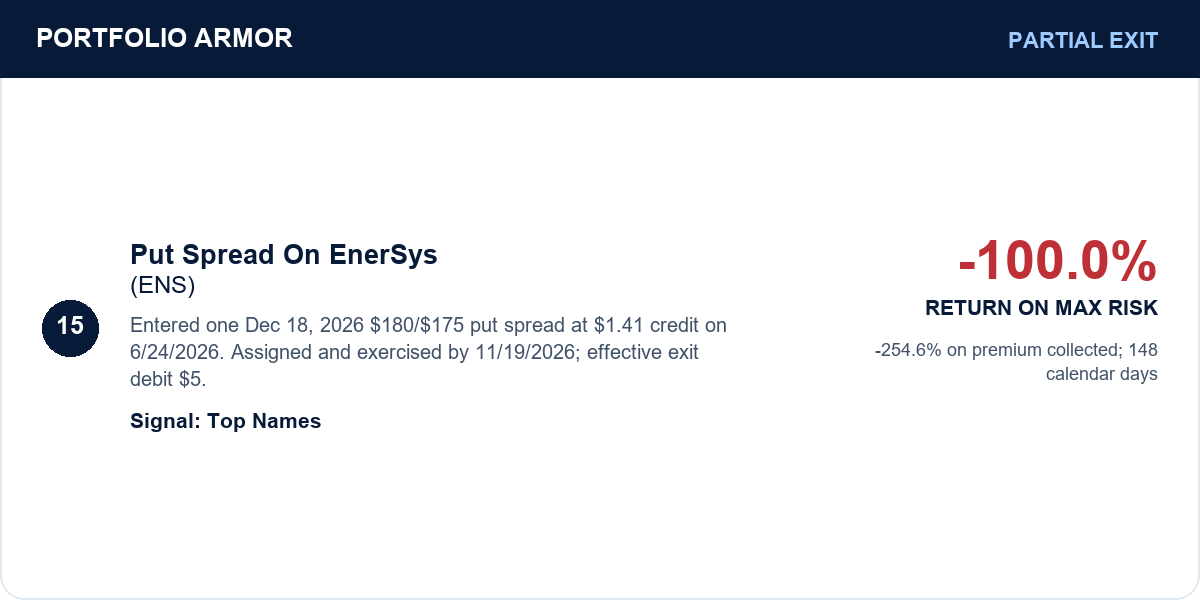
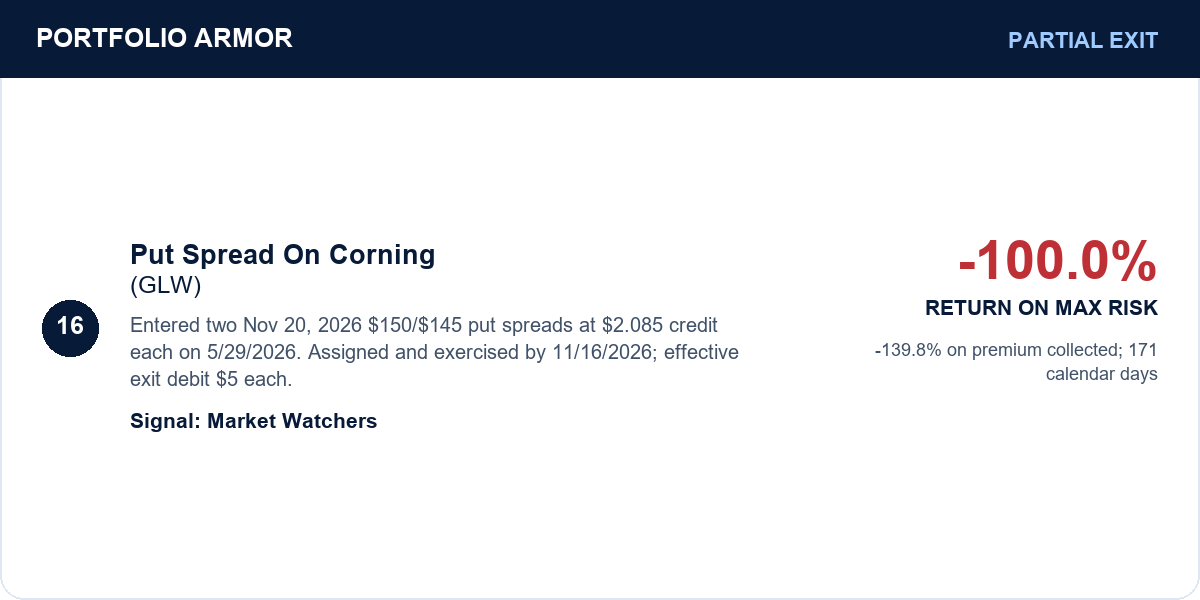
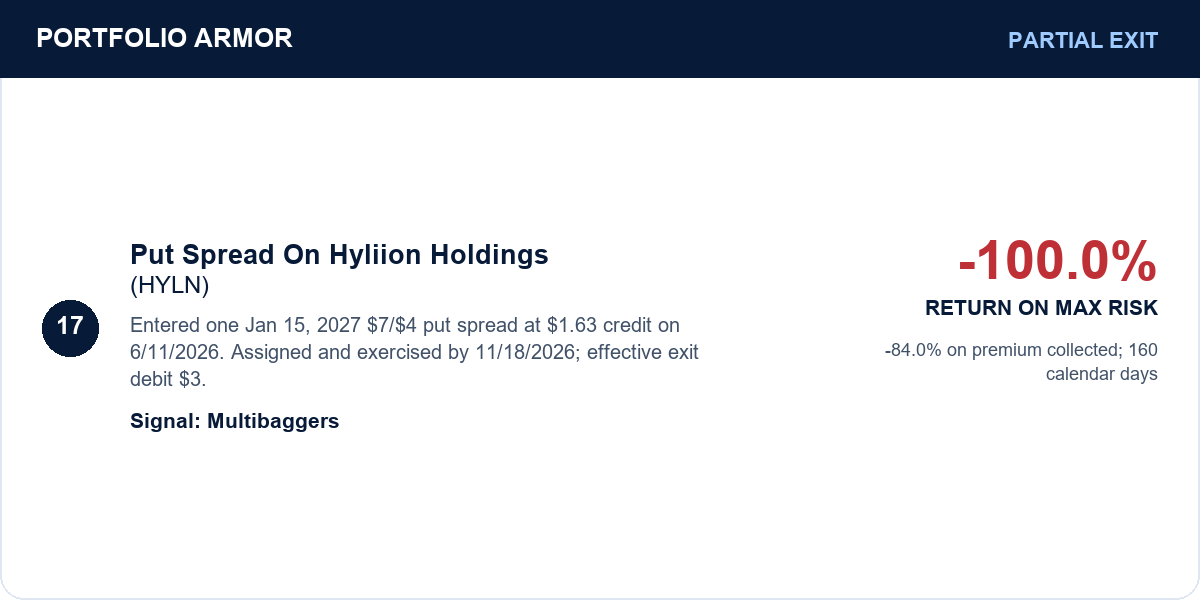
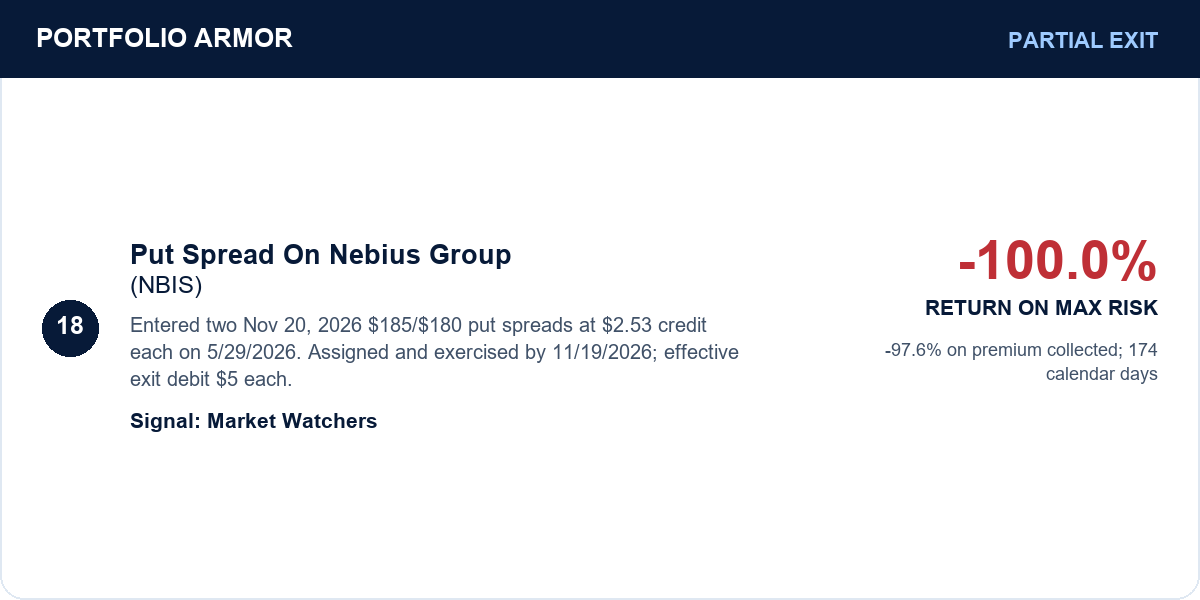
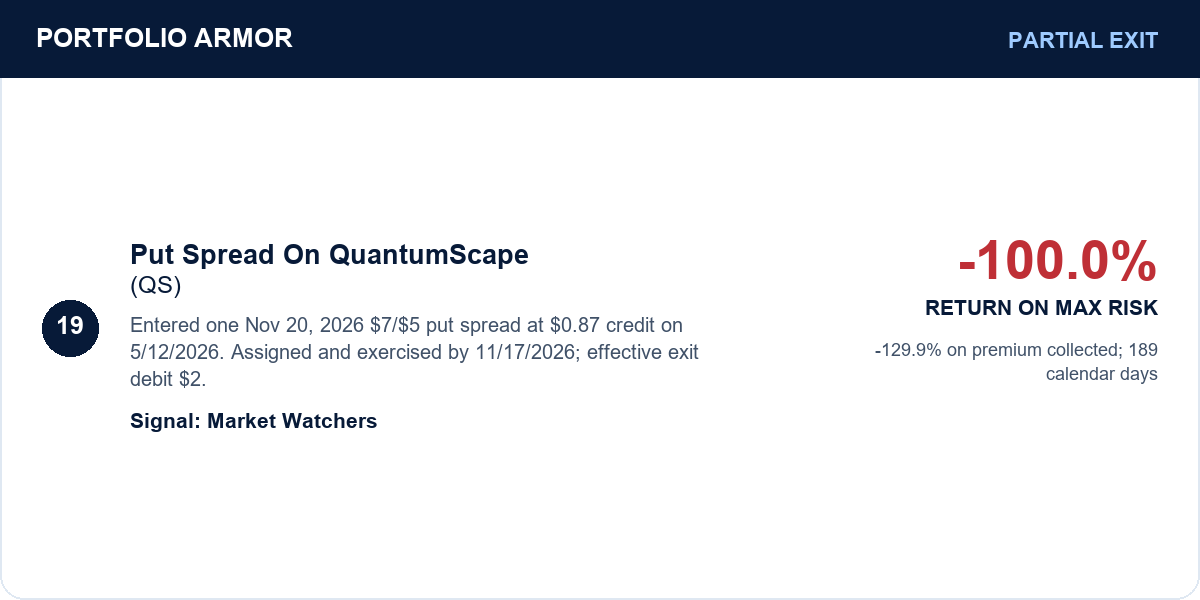
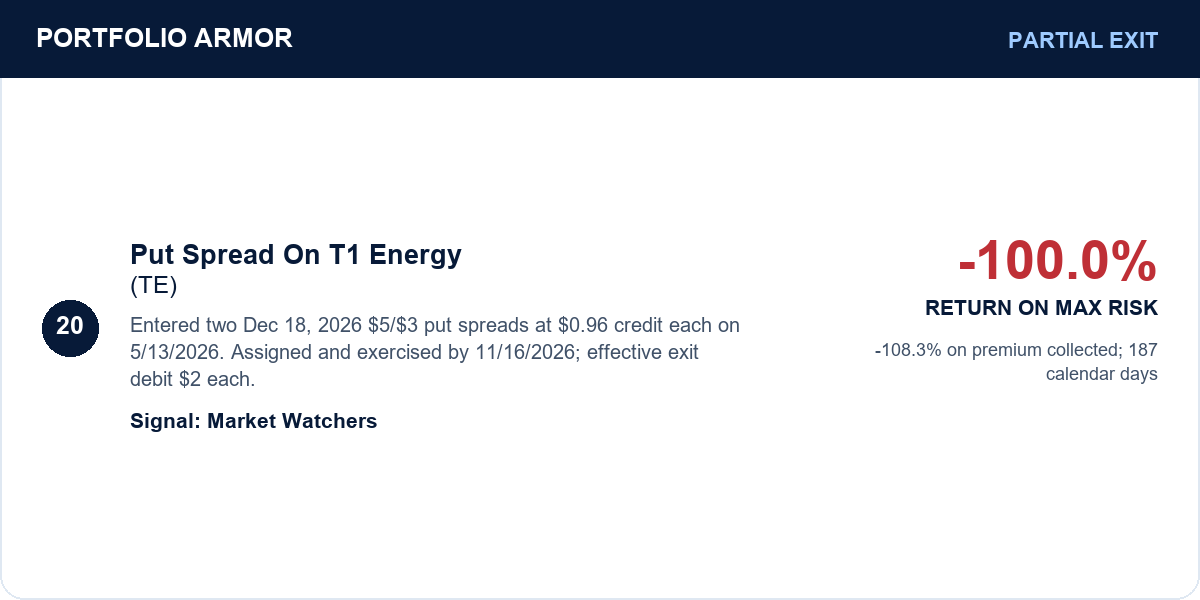
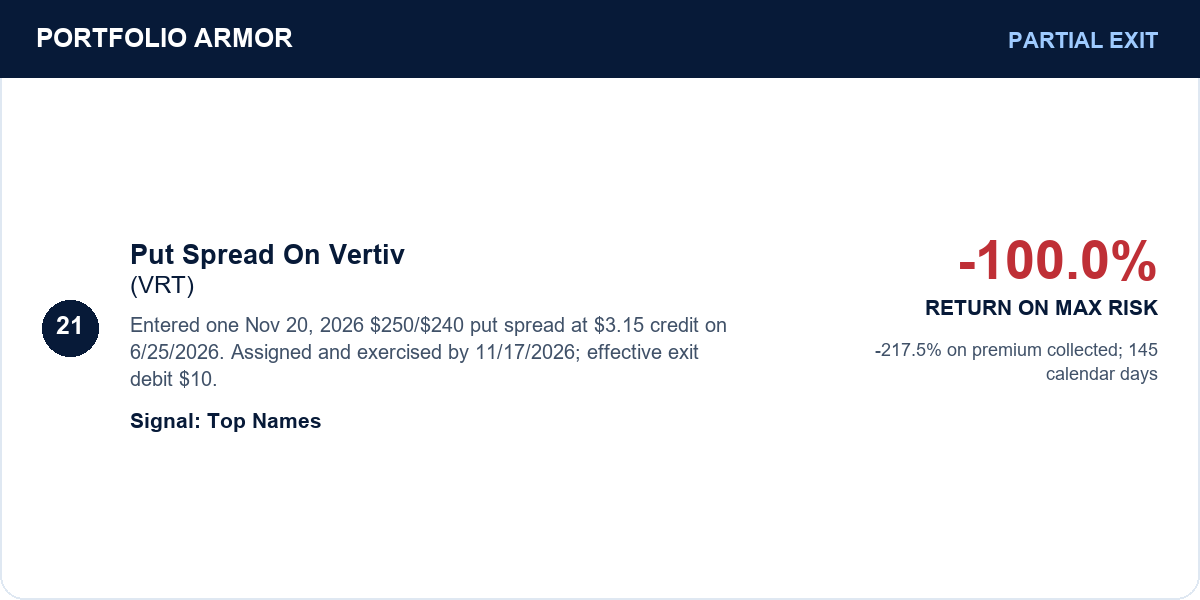
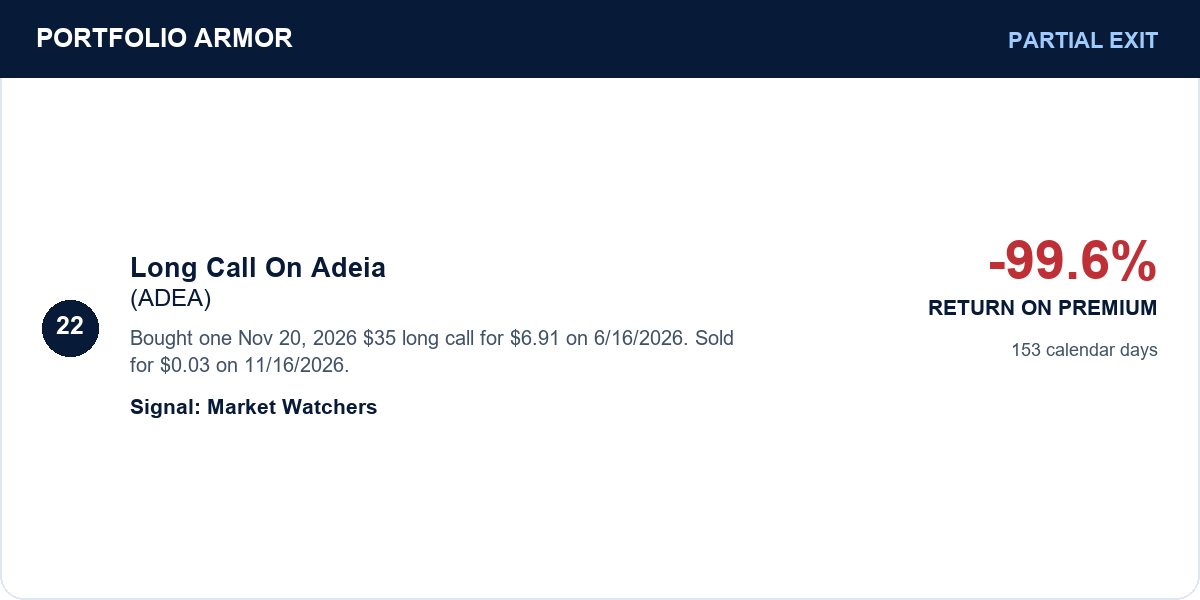
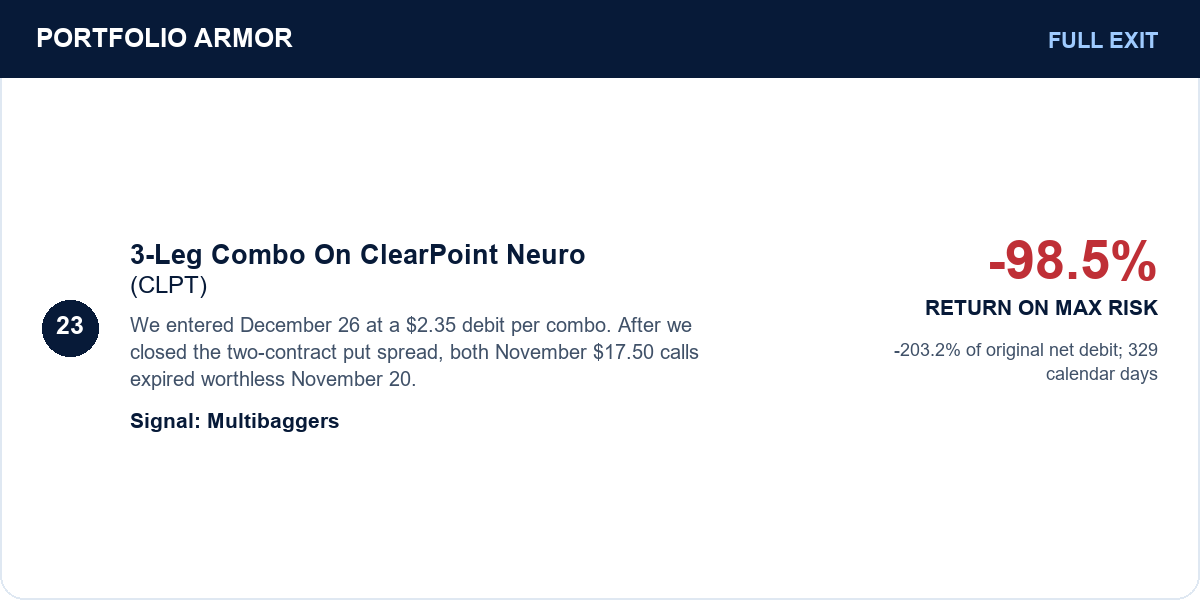
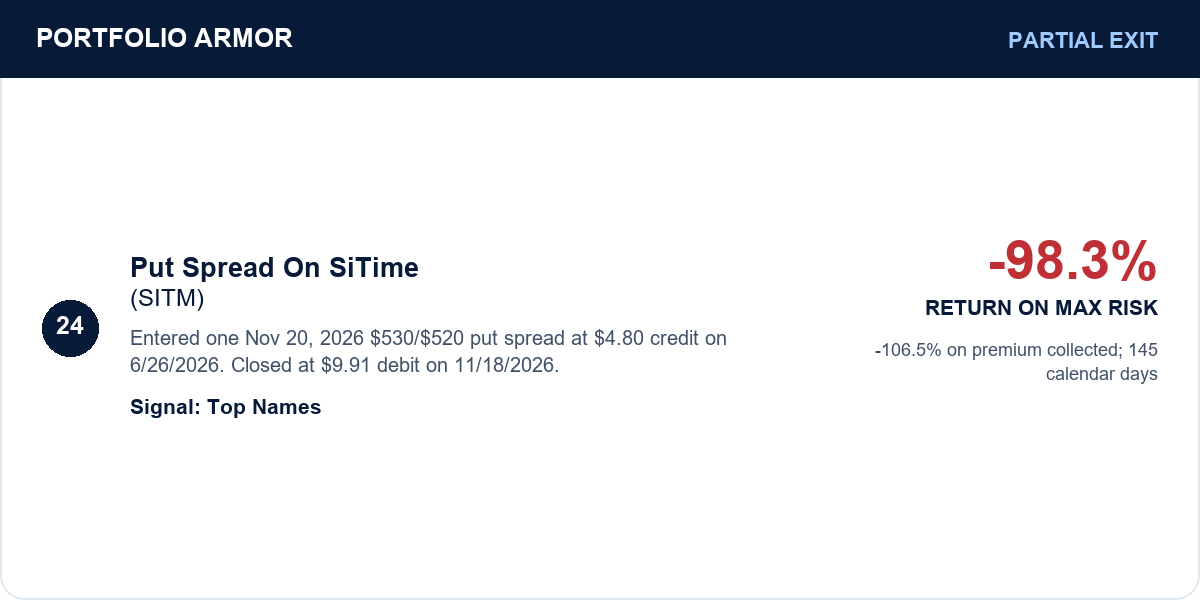
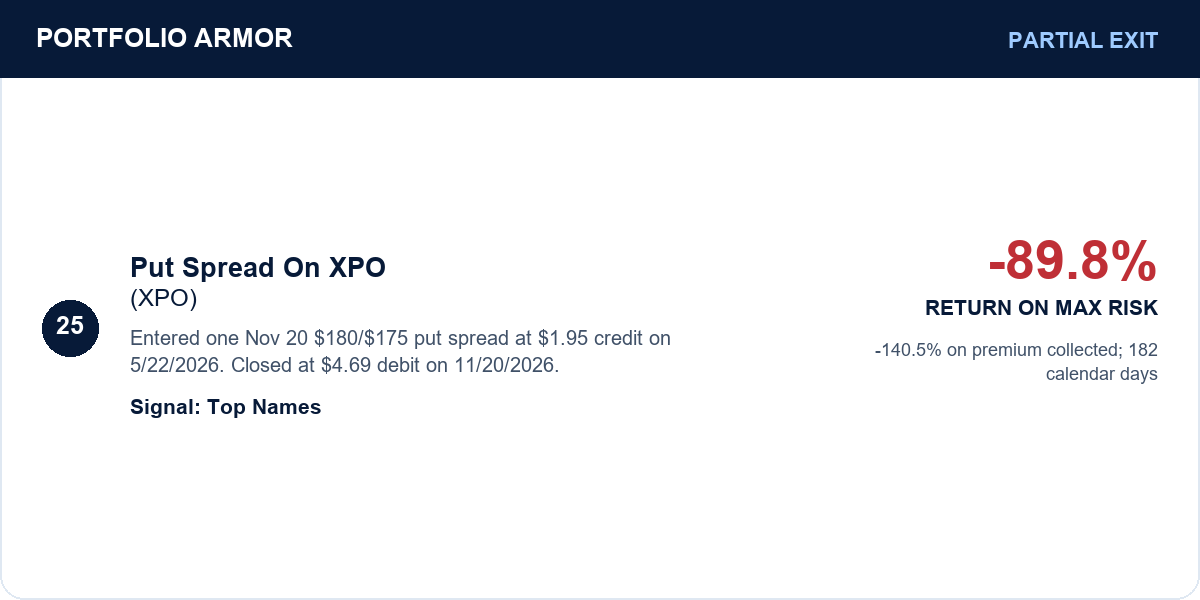
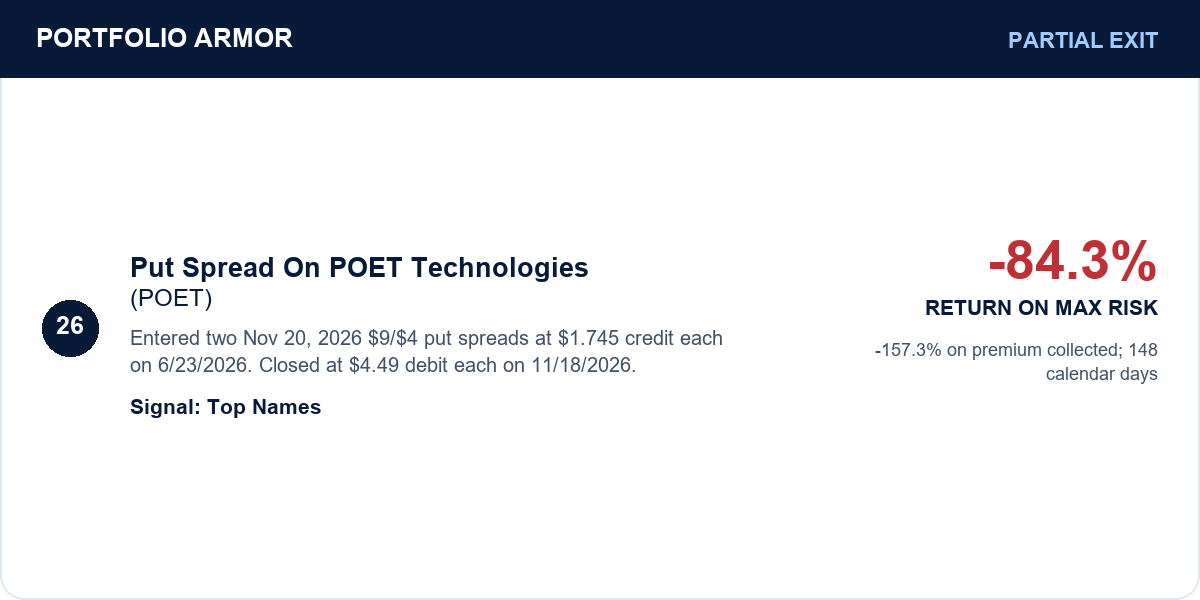
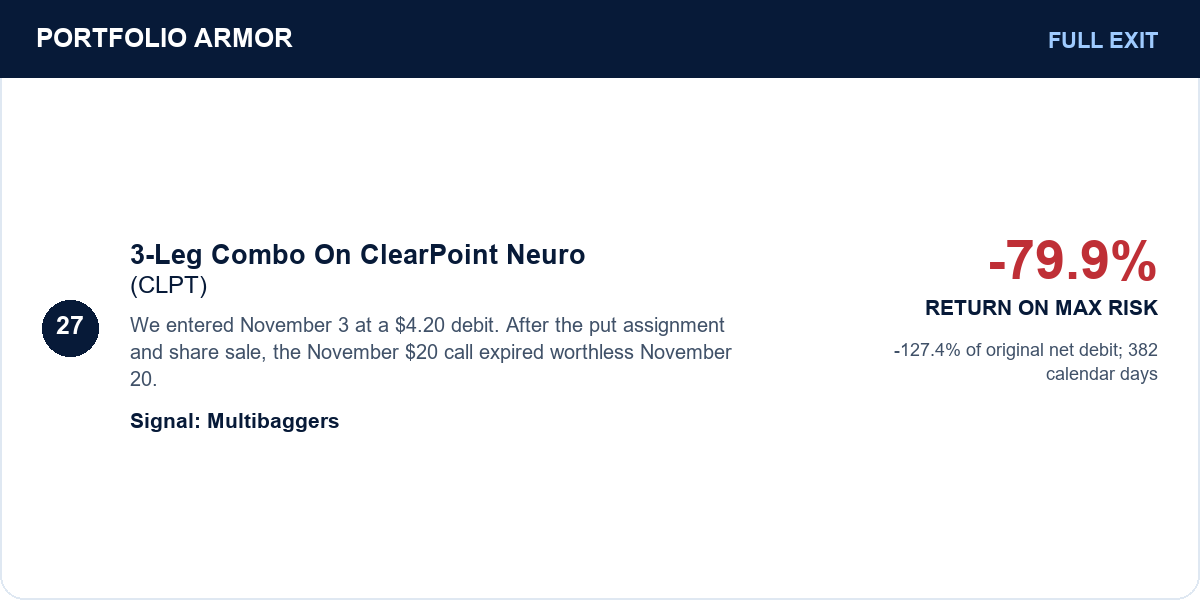
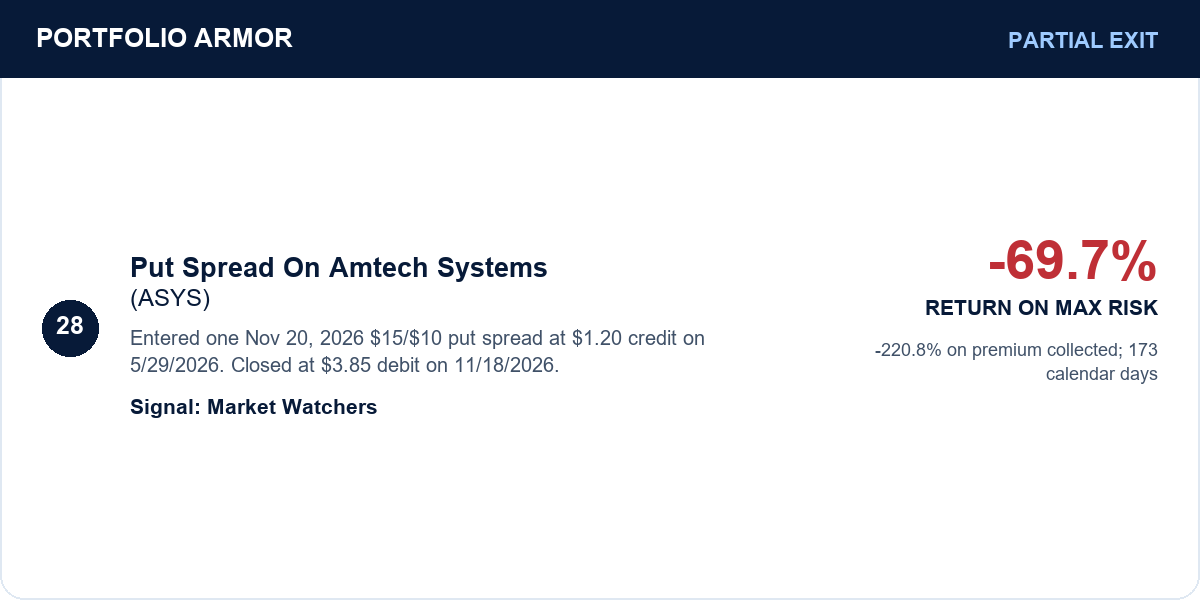
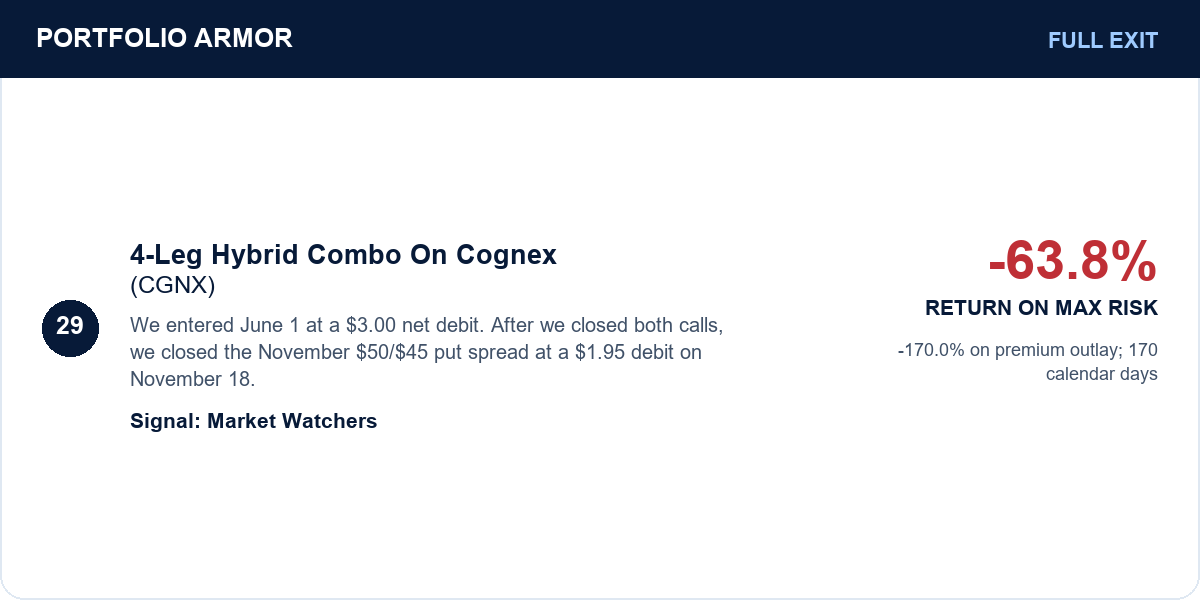
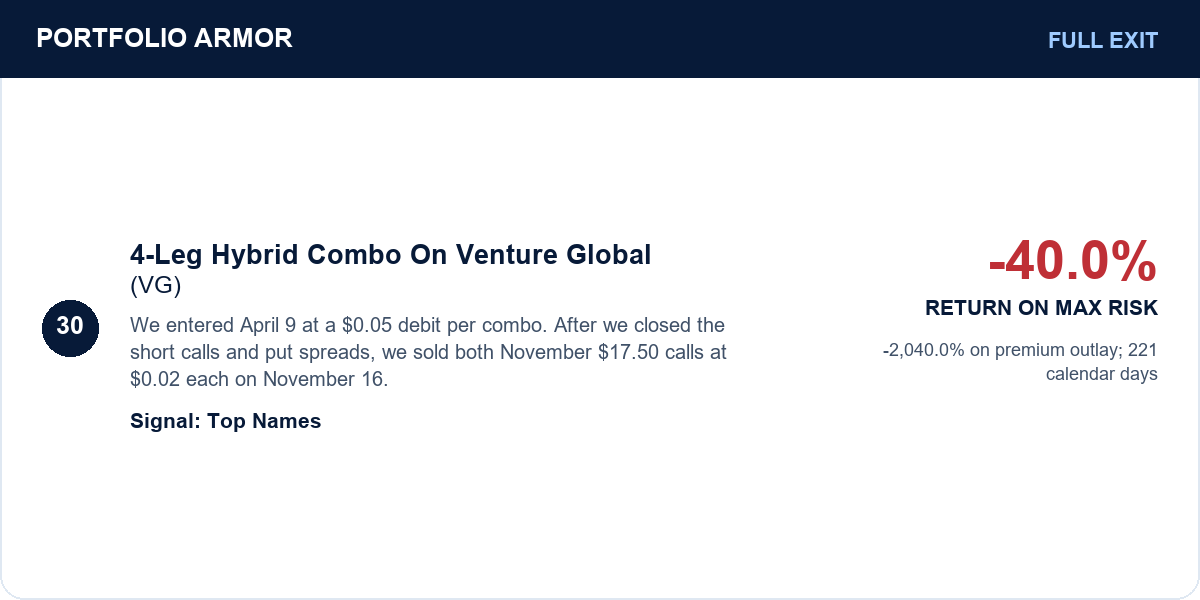
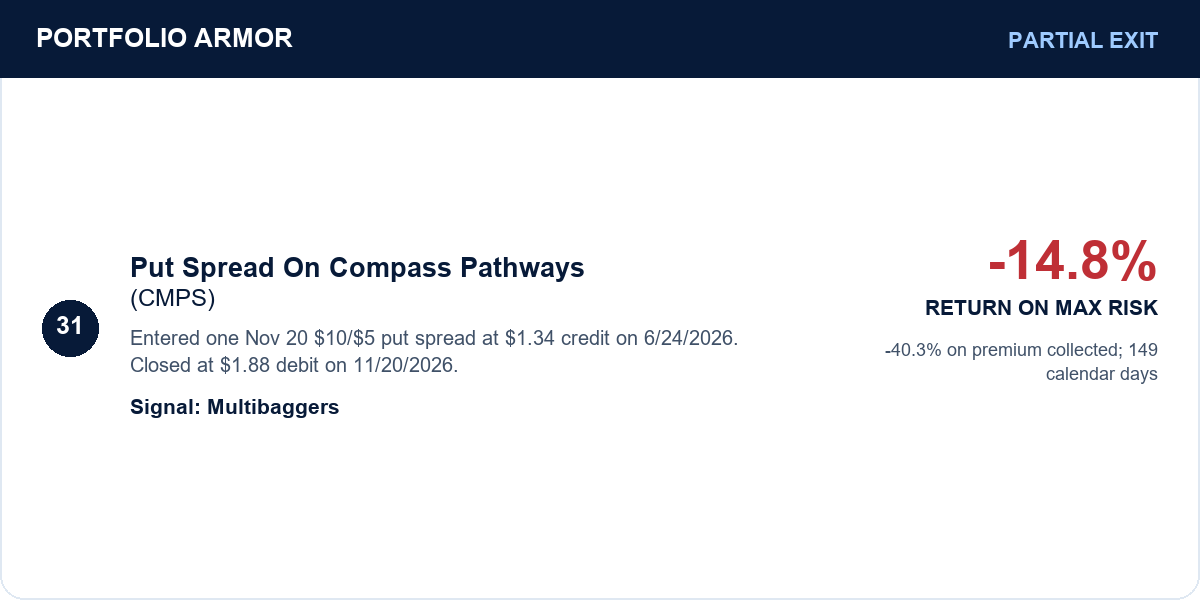
OpEx weeks are where our losses tend to collect. Our standing exit orders often get us out of winners before expiration, leaving more trades that never reached their targets. The market made that worse this week. The Nasdaq Composite fell 2.3% Thursday and another 5.3% Friday. Some of these trades date back to the beginning of the summer, near the peak in tech and momentum stocks.
In our recent post on Nvidia, we wrote that company reports and guidance pointed to continued AI spending. A. replied in the comments;
Well, that same evidence got us throwing dice at the peak of the bubble. For the sake of the process, I would like to see an article that details a little more introspection about past failures to predict the future.
We were early to parts of the AI trade. Last December, we traded Micron, Sandisk, and AXT.
For example, our AXT trade entered on December 29, 2025 returned 347.0% on original maximum risk when we completed it on March 2, 2026:

By June we were still adding exposure. Some investors I follow on X who were bearish on the buildout in June were bearish at the start, too. If you know someone who was bullish last December and changed his mind by June, let me know, because I’d like to follow him and learn from his approach.
What we saw at the time
I still hesitate to call it a bubble. The AI buildout was (and still is) producing real sales and rapidly rising earnings, and the valuations we were looking at were a long way from Cisco at the dot-com peak. Bubble or not, we entered some trades near the highs, and the stocks fell far enough that our options ran out of time.
Take Powell Industries. When we added a trade on June 29, it was one of our Top Names and passed our technical screens. Its RSI was 47, and its Chartmill technical, setup, and fundamental ratings were 9, 6, and 7, respectively. That RSI was well below overbought territory, and the fundamental rating supported our view that Powell’s valuation looked reasonable at the time. This week, Powell crushed its earnings. Nevertheless, the stock has fallen considerably from June, and we’ve taken losses on it.
I wondered whether we should have leaned more on our Top Names than our outside analysts for trade ideas. Our ranking system follows the data. It can cluster in a theme, but it has no attachment to it. I can get attached, as can our outside analysts. Instead of just wondering, my AI assistants and I looked at the data. We compared options trades entered since December 1, 2025 and fully closed by November 18, 2026, with gross returns measured against each trade’s original maximum risk.
Top Names: 77 closed trades; average return 28.3%; median −2.7%.
Market Watchers: 52 closed trades; average return 20.4%; median −0.2%.
Multibaggers: 25 closed trades; average return 73.8%; median 16.2%.
Top Names beat Market Watchers on average, but Multibaggers beat both. So it turns out my intuition was wrong. It’s always good to check the data.
Curveballs
We were already using RSI and setup scores on some of those December trades. In late June, we started giving fundamentals more of a vote and recording RSI and the three Chartmill ratings in the alerts. The July Situational Awareness unwind looked like a likely clearing event. We added recovery screens to look for stocks starting to turn while the business case held up. Later we began looking for bearish trades where guidance and estimates were falling in a downtrend.
One curveball I plainly missed was that the Iran conflict would still be unresolved in November. Higher oil prices kept pressure on inflation and rates, and higher rates raised financing costs across the AI stack.
Another curveball I missed was the apparent coup against Jensen Huang and how little confidence his interim replacement would command from the market.
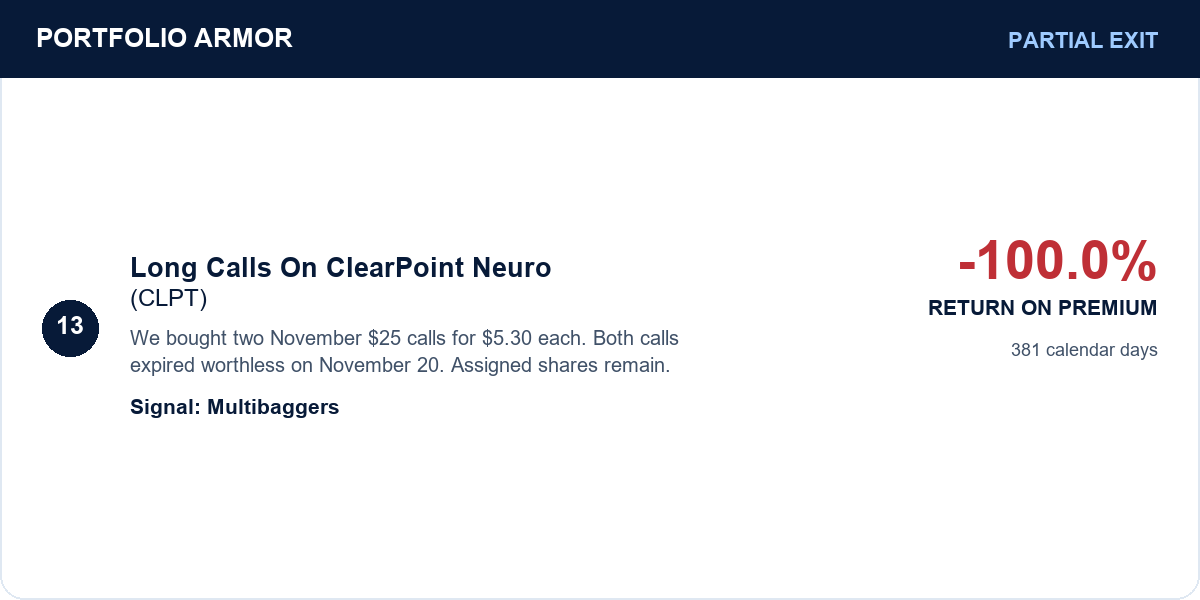
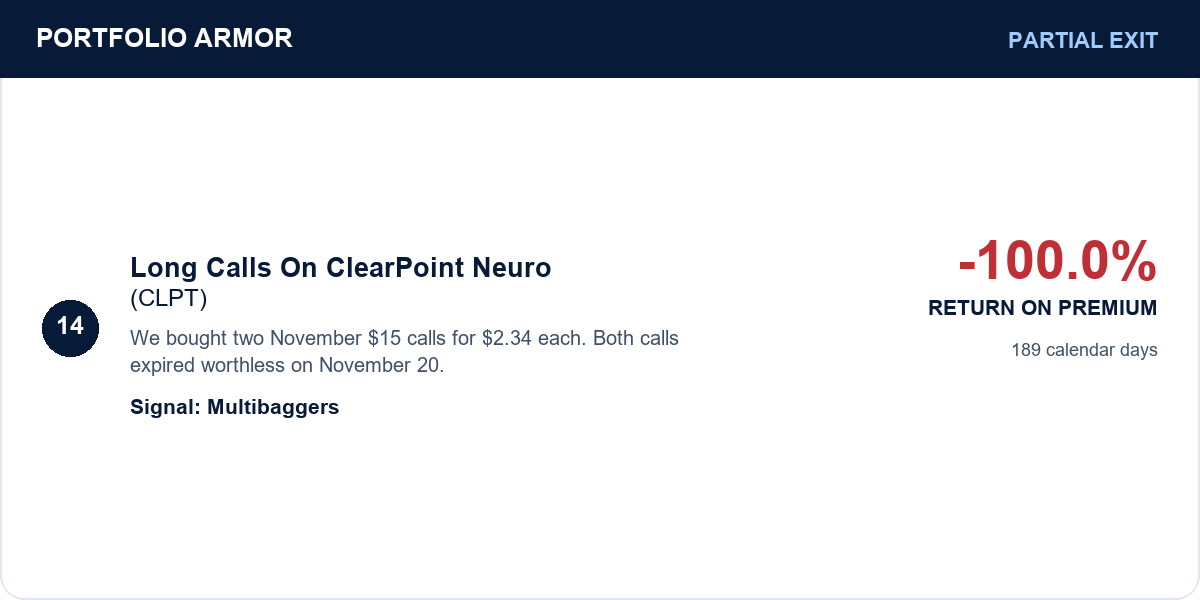
Concentration comes with our approach. In a strong theme, several of the best setups can show up at once. Passing over those setups simply to spread trades around can cost us returns, and staggered expirations give trades time to work (we neglected to do that with several CLPT trades that expired this week—we instead used the furthest-out expiration date, which ended up being not far enough). A lesson I’d take from this is to give financing conditions and key-person risk more weight going forward.
How we’re trading now
Our rules have mostly kept us from catching falling knives in the AI stack this month. Our recent bullish Nvidia trade was an exception. The numbers were as strong as we’d expected. I didn’t anticipate the reaction to the interim CEO’s appearance on Mad Money in the middle of this week’s selloff. We looked at that reaction in more detail on Zero Hedge.


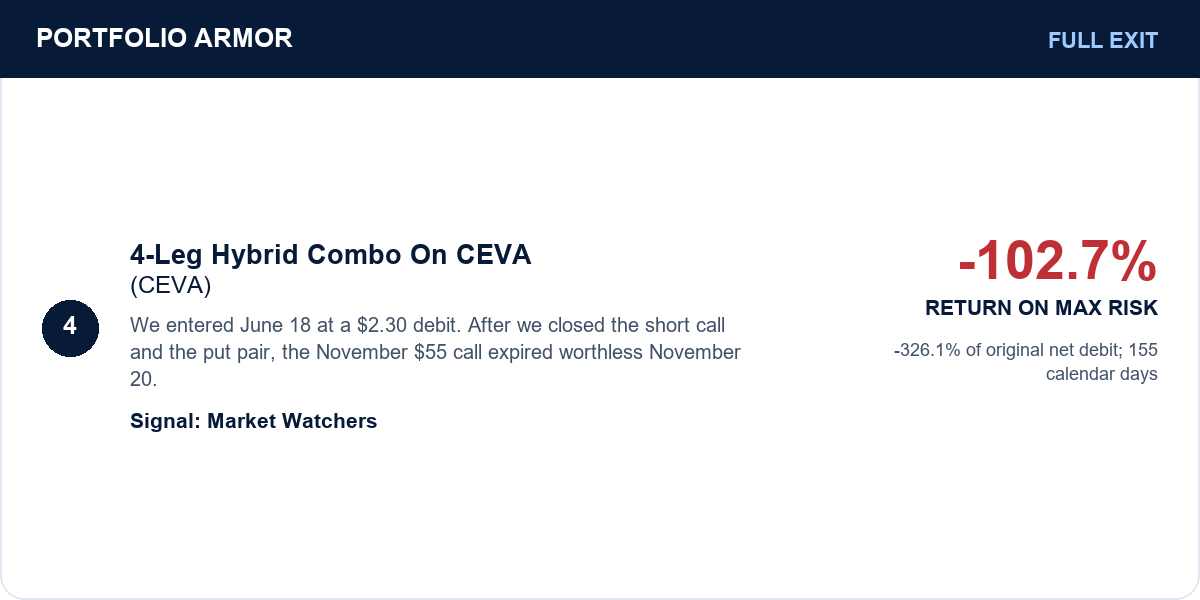
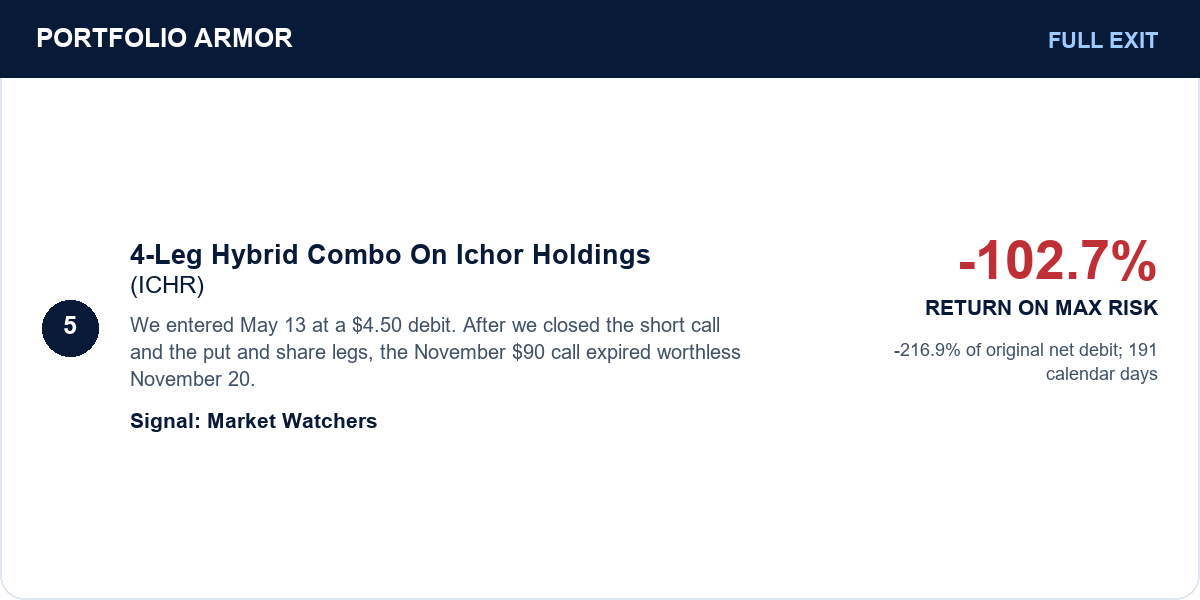
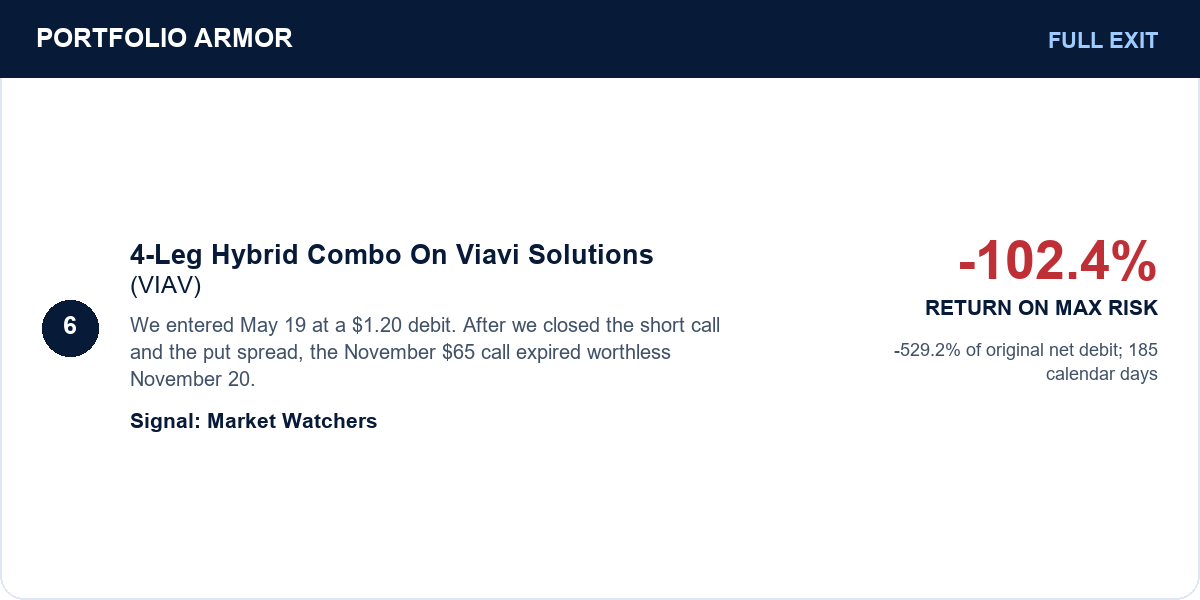
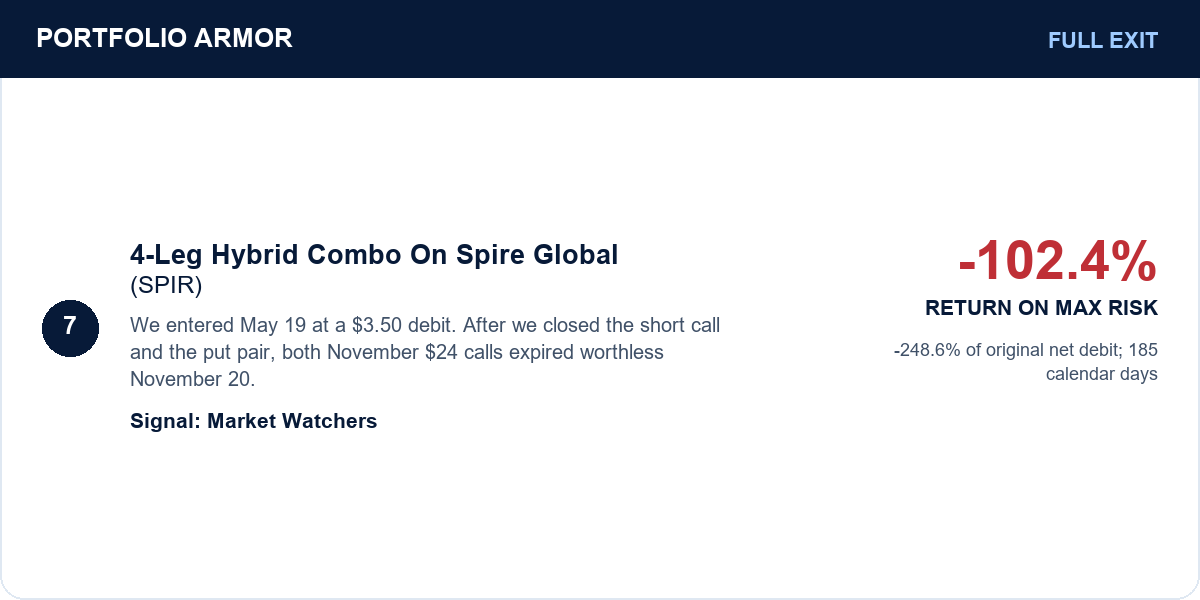
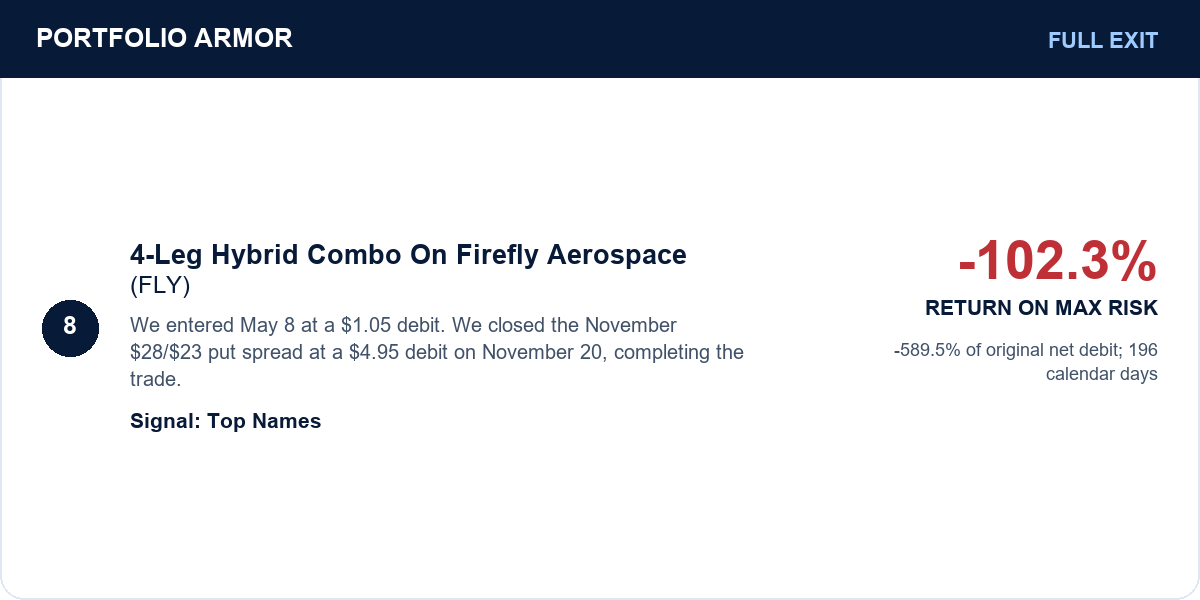
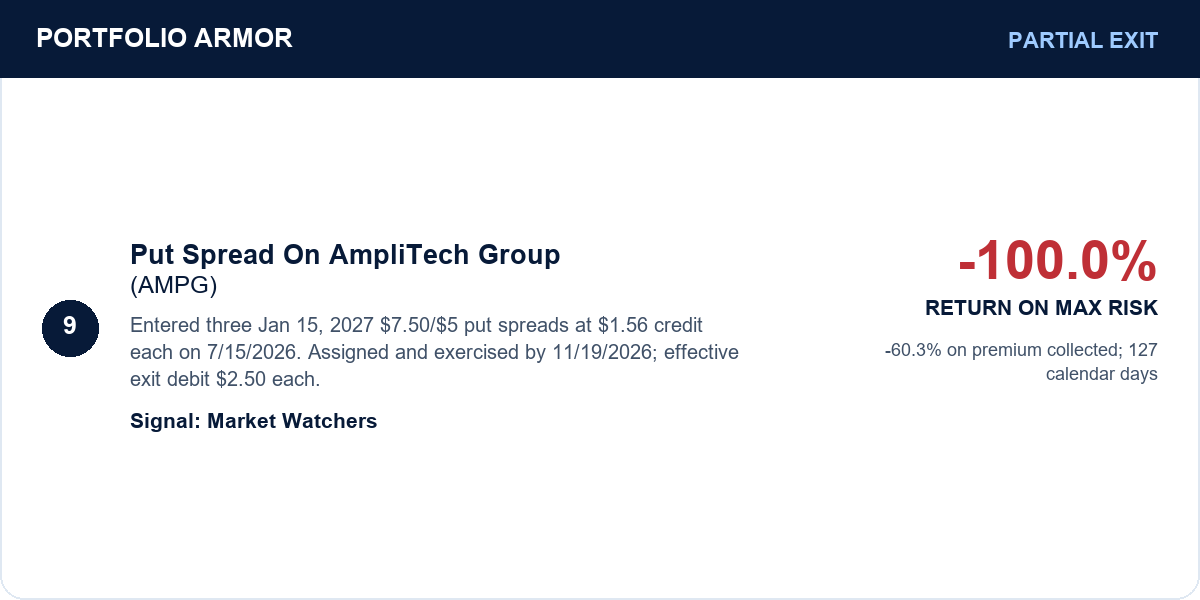
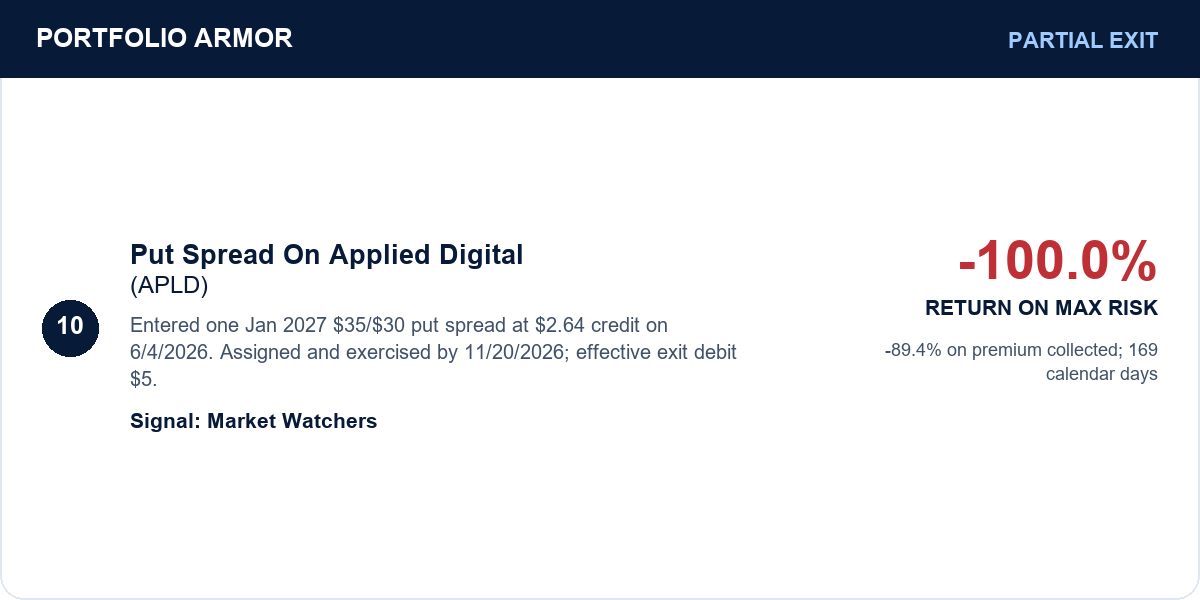
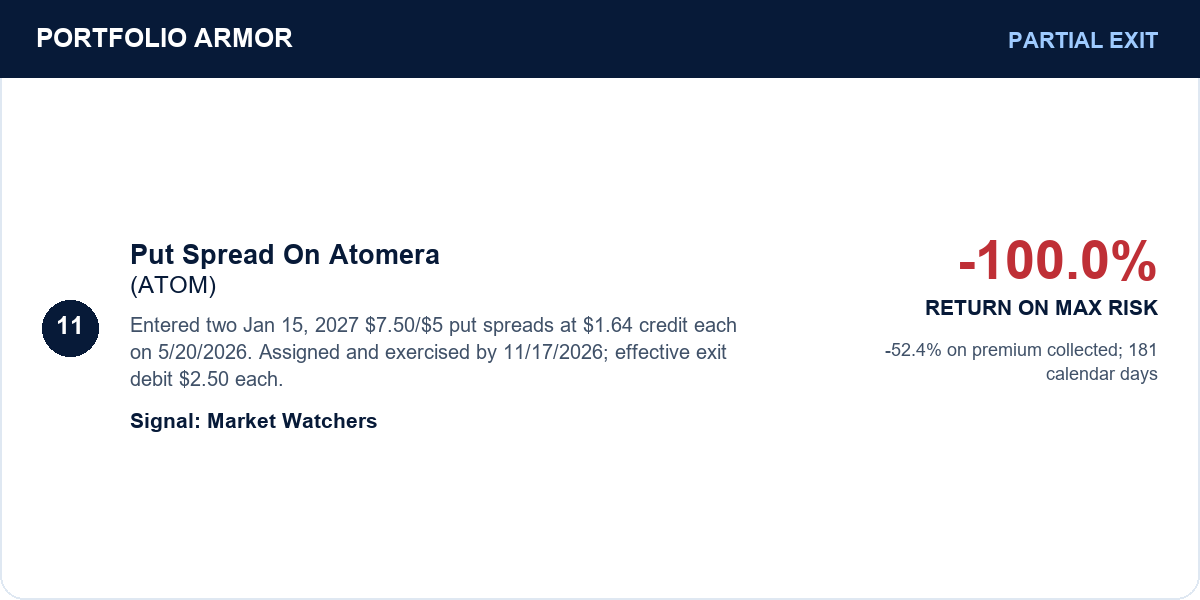
If a trade hinges on a question we can’t answer, it can go in the too-hard pile. How Nvidia will fare after Jensen is one of those questions.
What matters most now is where we go from here. Friday’s market action, including the huge volatility spike, had hallmarks of a capitulation bottom. We have screens designed to catch individual stocks that have likely bottomed. When names on our watchlist clear those screens, we’ll look to add bullish trades on them. At the same time, we’re also looking for bearish setups in defensive stocks that got expensive as money moved out of tech. We’ll go where the data take us.