



The Selloff Spread Beyond Tech
On Thursday, November 19, the Nasdaq Composite fell 2.3%. About 76% of the Nasdaq stocks in Investor’s Business Daily’s tally finished lower. From their October 19 closes, Nvidia is down about a third and Robinhood is down 29%.
Gold and Bitcoin fell too. S&P 500 futures were lower early Friday. On X, ChillBanking had a name for the move.

How A Margin Call Spreads The Selling
Say you buy $100 worth of stock with $50 of your own money and $50 borrowed from your broker. If the stock drops to $70, you still owe $50. Your equity falls from $50 to $20, a 60% loss on a 30% drop in the stock. Your equity now covers about 29% of the position. If your broker requires 30%, you’re below its maintenance requirement.
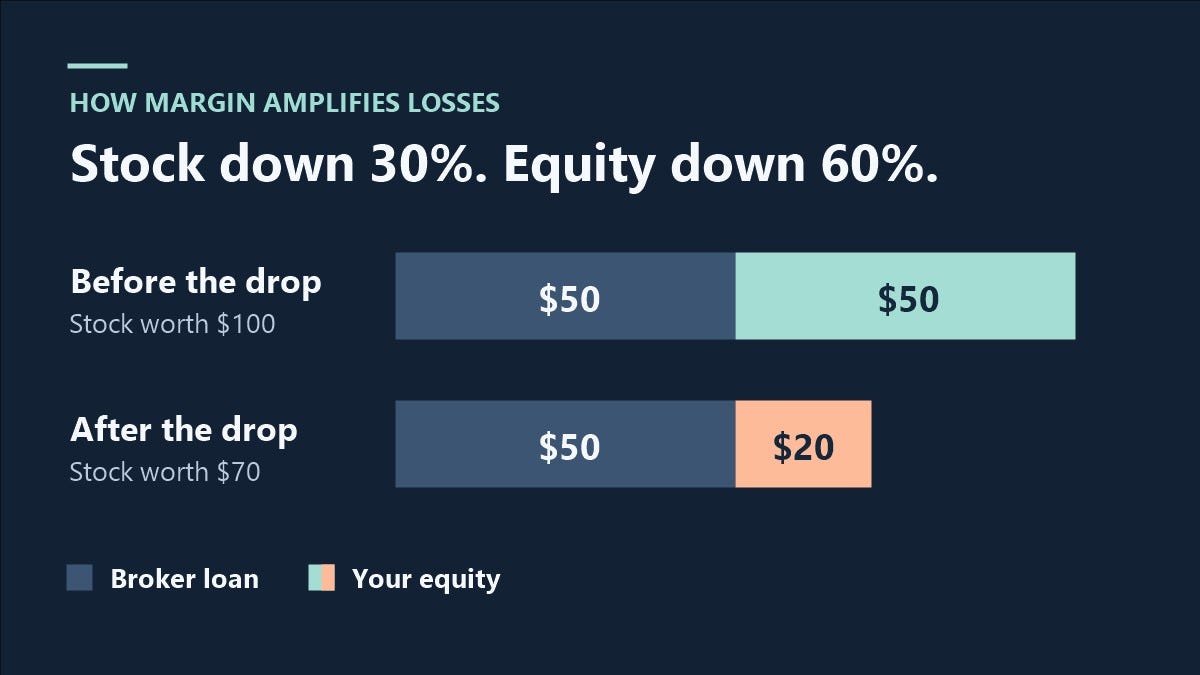
A broker can sell securities without notice to cover the shortfall. It can choose what to sell, including a holding you planned to keep. It can also raise its maintenance requirement in the middle of a selloff. If enough investors face the same pressure, selling can move from the stocks that started the decline to other assets that are easy to sell. Those lower prices can trigger more margin calls.
Even if you paid cash for every position, you can feel the effects in your own account. A fund that needs to raise cash may sell a bond or gold ETF it can move quickly. That can pull down holdings you bought to cushion a slide in stocks.
When Gold And Treasuries Fell Too
March 2020 showed how far the selling could spread. Stocks plunged, and at points gold and Treasuries fell alongside them. The Financial Stability Board’s review found that large Treasury sales by leveraged investors and foreign holders added to the strain as dealers struggled to absorb the supply.
Writing at Zero Hedge, Monetary Metals described how investors raised cash during the COVID crash.
Between March 9 and March 18, investors sold some of their most liquid assets as demand for cash accelerated.
Treasuries drew buyers on Thursday. March 2020 showed how much further a selloff can spread when investors urgently need cash.
How Much Downside Can You Live With?
It’s unnerving to open your account and see positions you bought for different reasons falling together. You may be wondering how much more of your account you can afford to lose.
We’ve been here before. Our Hedged Portfolio Method is a set-and-forget solution for risk-averse investors. You tell the tool how much you want to invest. You tell it how much downside you’re willing to risk. It builds a fully hedged, six-month portfolio for you automatically.
In our tracking record since June 2022, the portfolios with 25%, 30% and 40% loss limits beat SPY on average over their six-month runs, net of hedging and trading costs. The 20% group roughly matched SPY. You can set a loss limit as tight as 2%. On $2 million, a 4% limit means putting $80,000 at risk. A tighter limit usually means paying more for puts or giving up more upside through a collar, which helps pay for the put by selling a call.
Gold, bonds and bitcoin can all fall alongside your stocks. A put gives you the right to sell your stock at a set price. Say your put lets you sell at $100. If the stock falls from $90 to $89, that right goes from being worth at least $10 a share to at least $11. It can be worth more because the stock still has time to fall further before the put expires. The ultimate hedge is the right to sell what you own at a higher price. Everything else is hope.
A 4% Risk Limit Put To The Test
On September 12, 2019, our system built a $2 million model portfolio hedged against a decline of more than 4%. The original portfolio below shows the optimal puts and collars, including puts on the gold and bond ETFs. The tool used some leftover cash for a tightly collared Alphabet position, seeking a better return than cash within the portfolio’s risk limit. The hedges cost $36,615 in total.
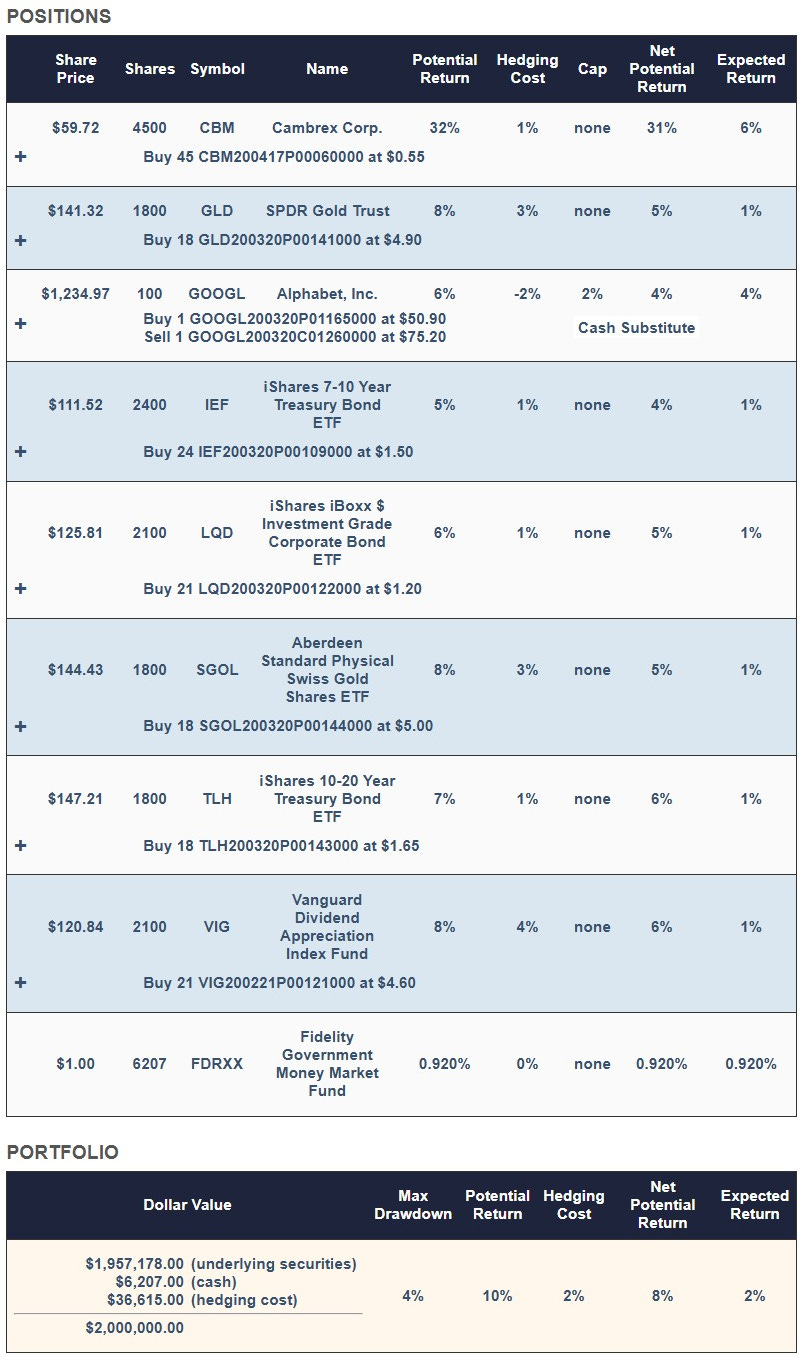
Its six-month run ended on March 12, 2020, the day the S&P 500 fell 9.51%. The corporate-bond ETF shows what the hedge did. In the model, the ETF’s shares lost about $12,600, and its puts gained $8,400 before trading costs.
Over the full six months, the model portfolio gained 2.71%, while the site’s SPY comparison lost 17.72%. The tracker shows both from the same $2 million starting point.
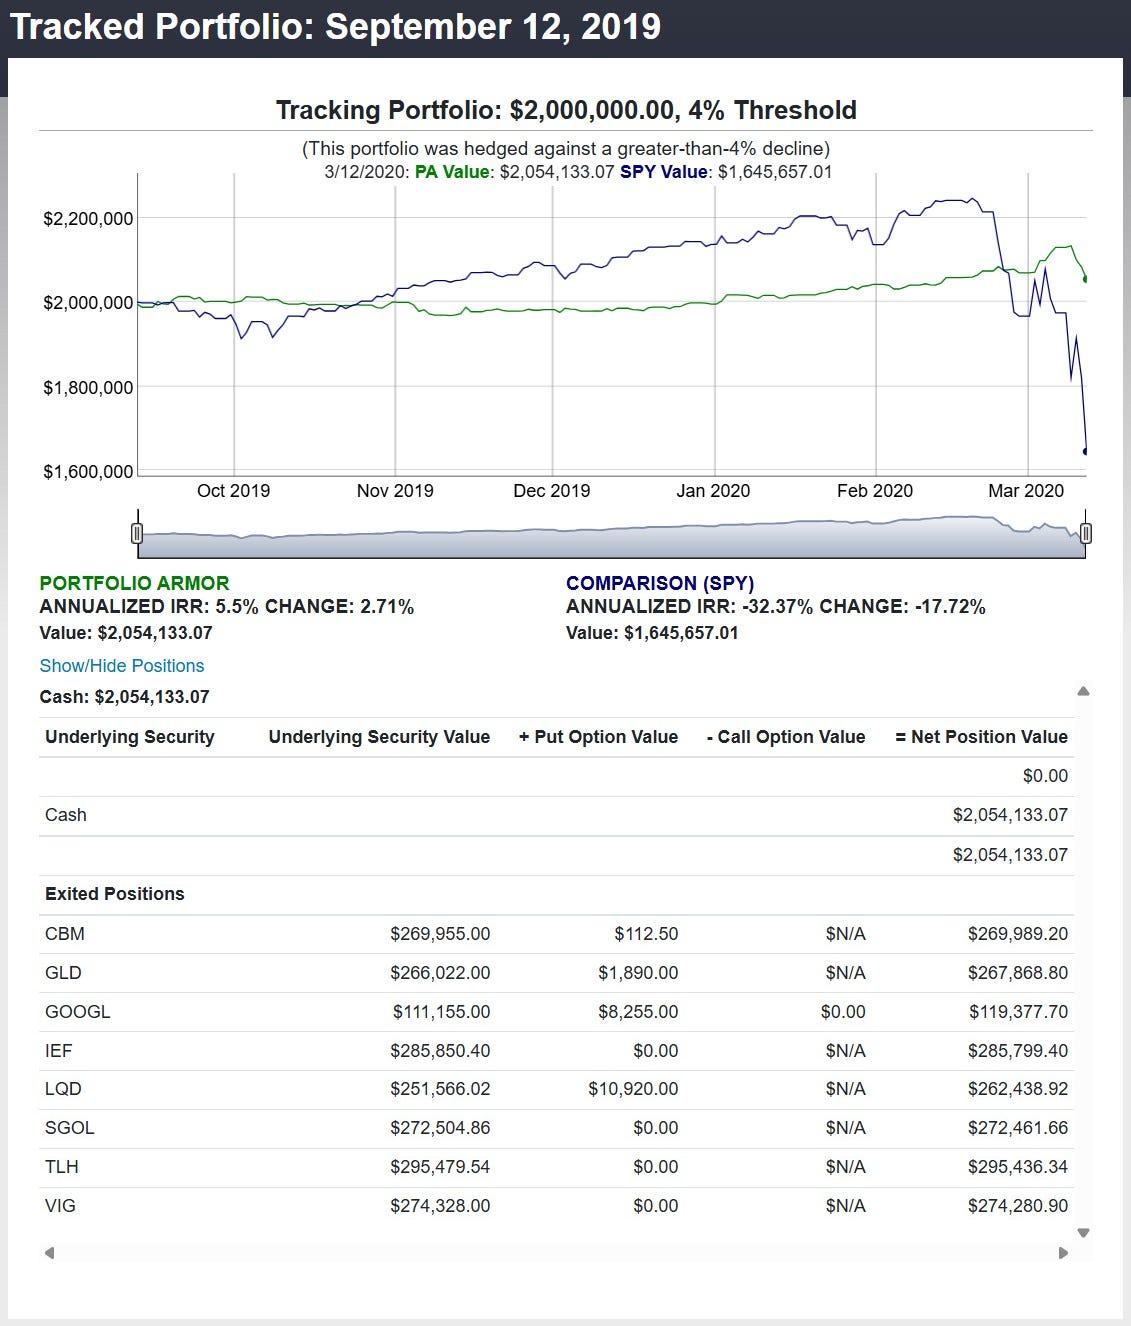
The portfolio went into the crash with its 4% loss limit already in place. You can build a portfolio around your own limit with Portfolio Armor Premium.
Know an investor wondering how to ride out this selloff? Share this article with them.
For more on how we manage risk and what we’re trading, subscribe to The Portfolio Armor Substack.
New to our alerts? Our Start Here post explains how we find and structure trades.
