



A Recent Example Of The Edge
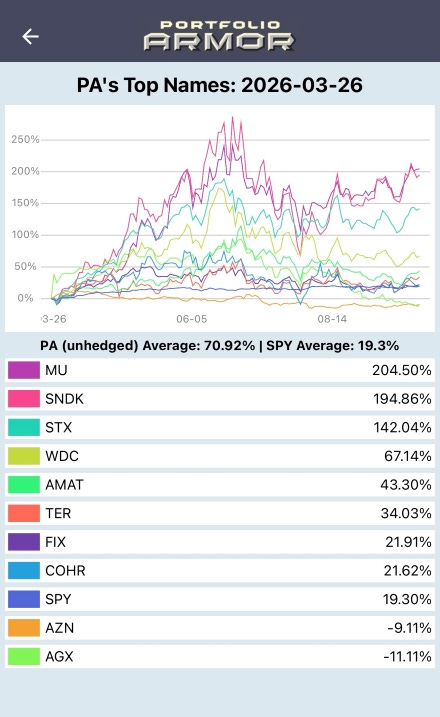
Portfolio Armor’s March 26th Top Names returned an average of 70.92% over their six-month tracking period, versus 19.30% for SPY. The chart below shows the result for each member of that cohort.
The Record Behind The Example
Across all 170 completed weekly cohorts selected from December 29th, 2022 through March 26th, 2026, our Top Names averaged 17.94% over six months, versus 9.85% for SPY. They beat SPY in 110 of those cohorts. The comparison below summarizes their average returns.

Each cohort is tracked for six months, so the periods overlap. These are average unhedged stock returns. Our Top Names performance table shows every completed cohort, including losing ones.
One Signal, Two Ways To Use It
Portfolio Armor ranks optionable securities by potential return net of optimal hedging cost, using historical returns and option-market sentiment. That stock-selection process is the common starting point.
For investors who prefer buying shares, Portfolio Armor Basic provides daily Top Names access. You can use the list to choose stocks to own. Basic also includes tools for finding optimal puts and collars on individual holdings.
On our Substack, we use Top Names to find candidates for options trades, then apply additional setup checks and choose the structure, entry price and management plan. Two now-closed trades show how we’ve put that selection edge to work.
From A Top Name To An Options Trade
Western Digital (WDC 0.00%↑), whose hard drives store data in AI facilities, gained 67.14% in the March 26th stock cohort. It also passed our additional momentum and setup screens.
Our March 27th alert treated the war-driven selloff and fears about Google’s TurboQuant as a buying opportunity.

We paired a bullish call spread with a shorter-dated put spread, giving the thesis several months to play out. The historical entry card shows our actual fill, opening risk and advance exit plan.

We closed the puts on April 14th and the calls on June 3rd at the prices published at entry. The result was a $683 gross profit—114% on original maximum risk in 68 calendar days, before fees—as the exit card shows.

Why We Didn’t Add Another Micron Trade
Micron Technology (MU 0.00%↑) was already in our options portfolio on March 26th, so we didn’t add another trade then. We’d opened the position on March 3rd. The company supplies memory for AI data centers and led the March 26th cohort with a 204.50% stock return.
Our March 3rd alert paired June calls with an April put spread. The historical entry card shows the four-leg structure, actual fill and management plan.

We closed the puts on April 8th and the calls on May 5th, again matching the exit prices published at entry. That produced a $1,318 gross profit—173% on original maximum risk in 63 calendar days, before fees. Here’s the exit card.

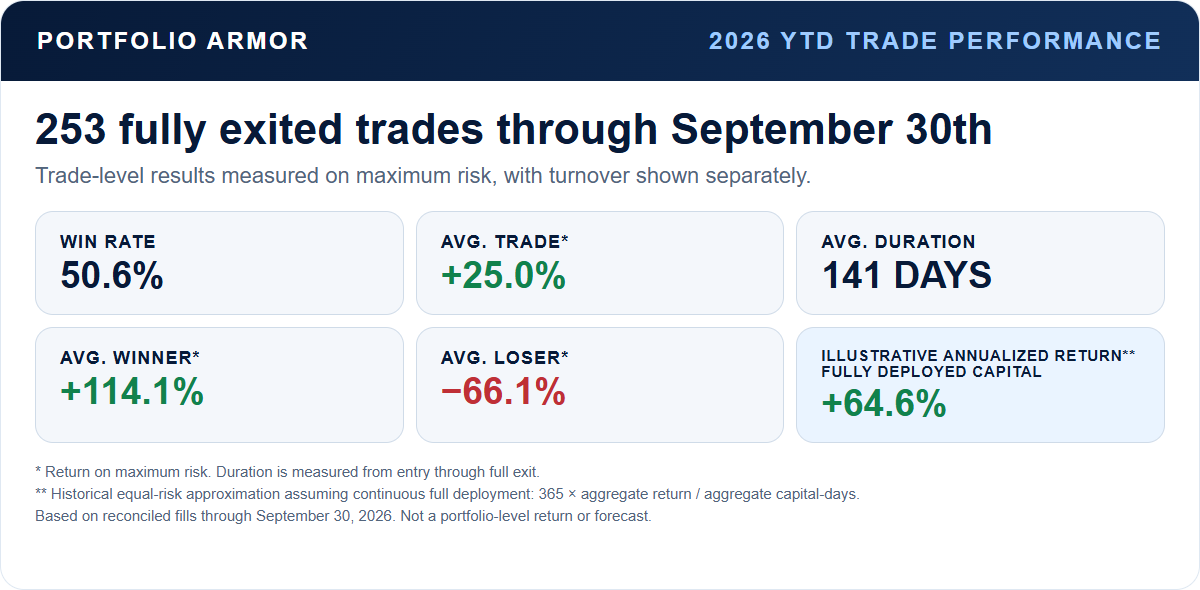
We report all our exits, win or lose, in our weekly Exits posts and public spreadsheet. The card below summarizes our year-to-date results through September 30th across Top Names and our other trading signals.
Putting The Edge To Work
We’ll keep looking for strong candidates and attractive ways to trade them.
Know someone looking for new investment ideas? Share this look at our Top Names and how we’ve traded them.
Paid Substack subscribers receive our selected options structure, entry limit and advance management plan, plus fill updates and follow-up. Our trade alerts are delivered premarket, before regular-session fills.
Our Start Here page includes a public sample alert and our execution guide.
