

When The Selling Spread
The Nasdaq Composite lost 10.0% for the week. Friday’s drop wiped out its gain for the year. The S&P 500 fell 8.6%, its worst week since April 2025. Based on Nasdaq’s closing prices, it was the index’s 10th-worst week in 50 years.
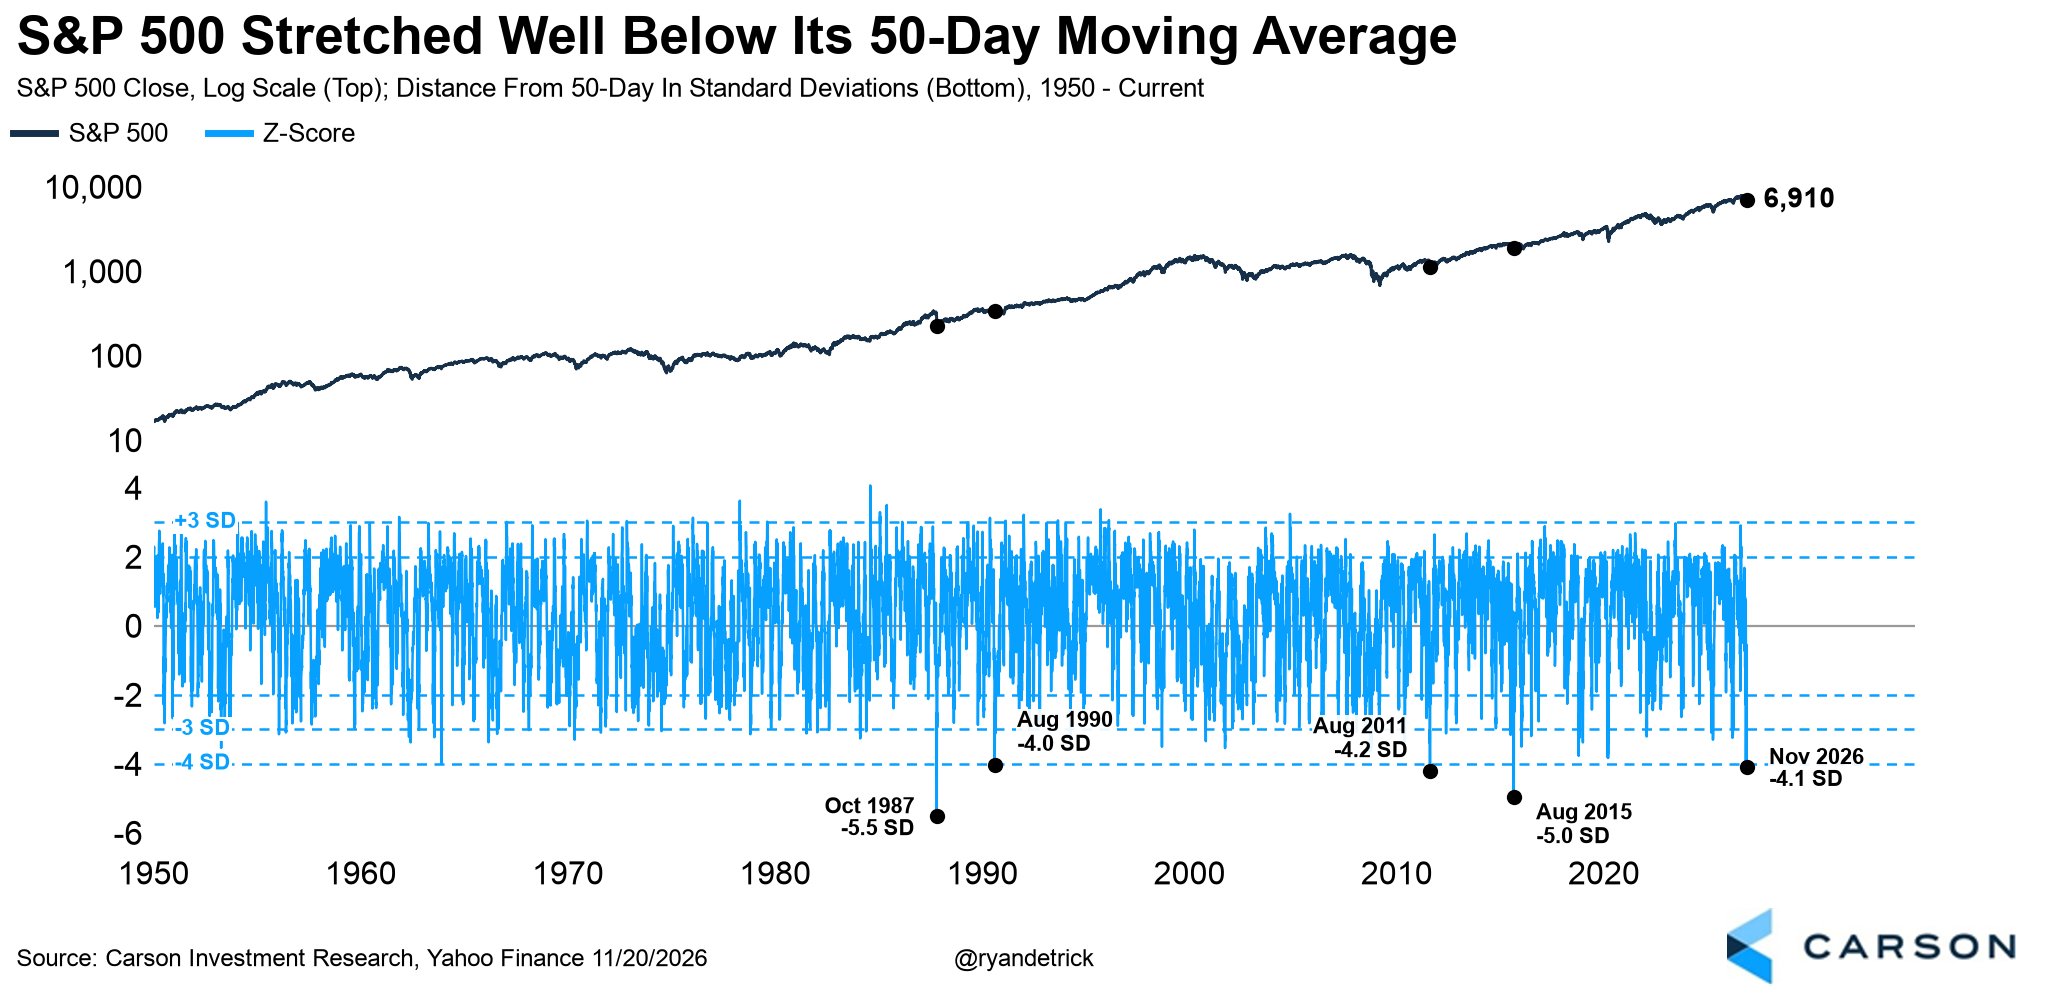
By Friday’s close, the S&P 500 was 4.1 standard deviations below its 50-day moving average, according to Carson Investment Research’s Ryan Detrick. His chart puts Friday’s reading alongside some of the market’s steepest breaks since 1950.

How We Traded It
Monday — Software’s AI Winners
We looked for software businesses that could turn AI into demand for their own products. Our setup targeted a company that helps customers manage a risk AI creates.

Tuesday — Power and Profits
We looked at the electrical equipment needed to power the AI buildout and at an established software business that was already profitable.

Wednesday — Profits Behind The Growth
We revisited a Top Name whose profits grew faster than revenue and whose shares had just given us a technical signal. The day order was canceled.

Thursday — A Cybersecurity Rebound
We looked for a cybersecurity recovery in two businesses. We wanted to see strong sales growth reach the bottom line at one and sales stabilize at the other, which was already profitable. One of the two orders went unfilled.

Friday — Trading A Sea Of Red
We tried again on the cybersecurity trade that went unfilled Thursday and added a bearish setup in a defensive name whose rally was losing momentum. Both orders filled at our original limits.

This Week’s Exits
It was a rough week for our trades. We recorded 54 options exits, including 15 full exits and 39 partial exits. 23 exits made money and 31 lost money. Among the full exits, three were winners and 12 were losers.
It was also a monthly options expiration week, when our losses tend to cluster as contracts expire. This one coincided with the Nasdaq Composite’s 10th-worst week in 50 years.
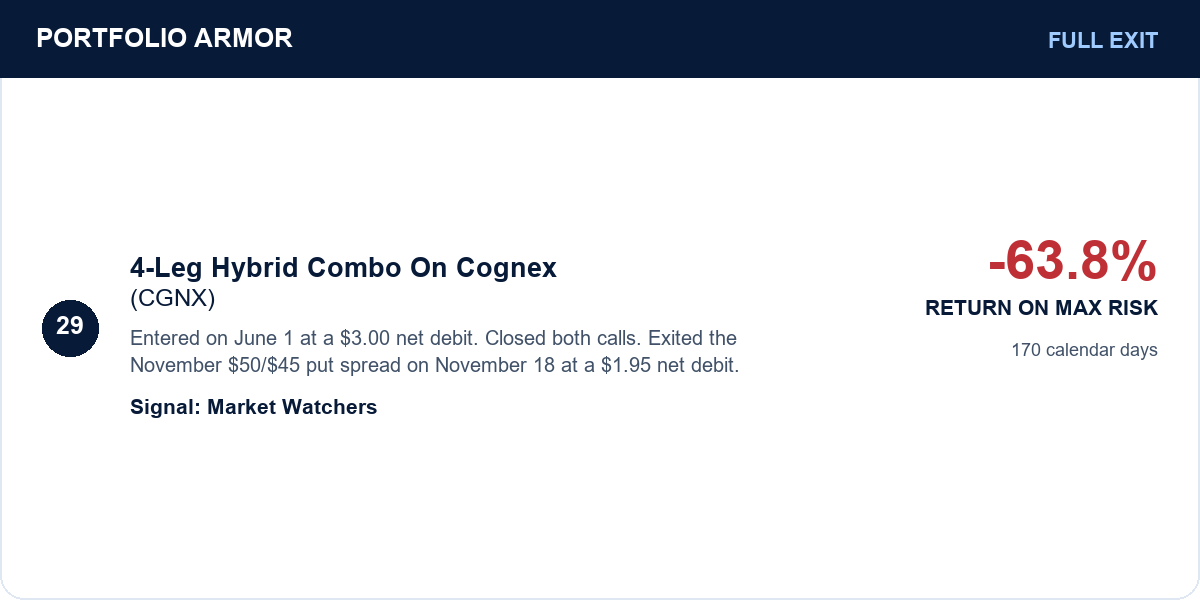
We fully closed our Cognex trade on November 18 for a 63.8% loss on original maximum risk before fees. After closing both calls, we closed the remaining put spread.

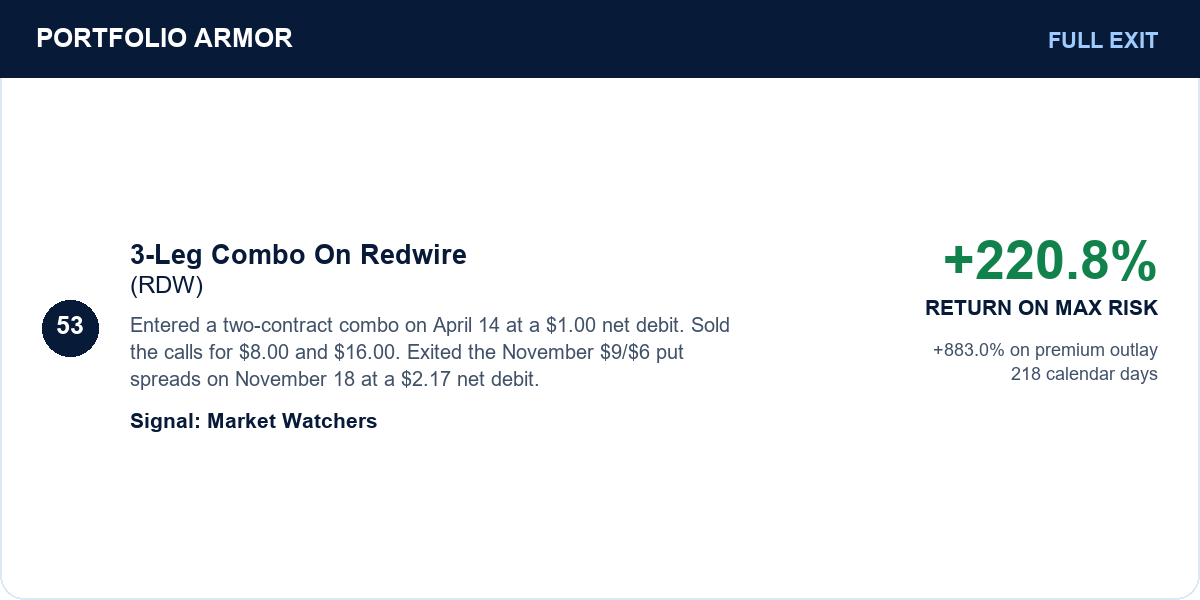
We completed our Redwire trade on November 18 for a 220.8% gain on original maximum risk before fees. We’d already sold the calls. Closing the remaining put spreads completed the trade. The card shows the entry and both stages of the exit.

This week’s Exits post has the full list and a closer look at how we traded the AI buildout.

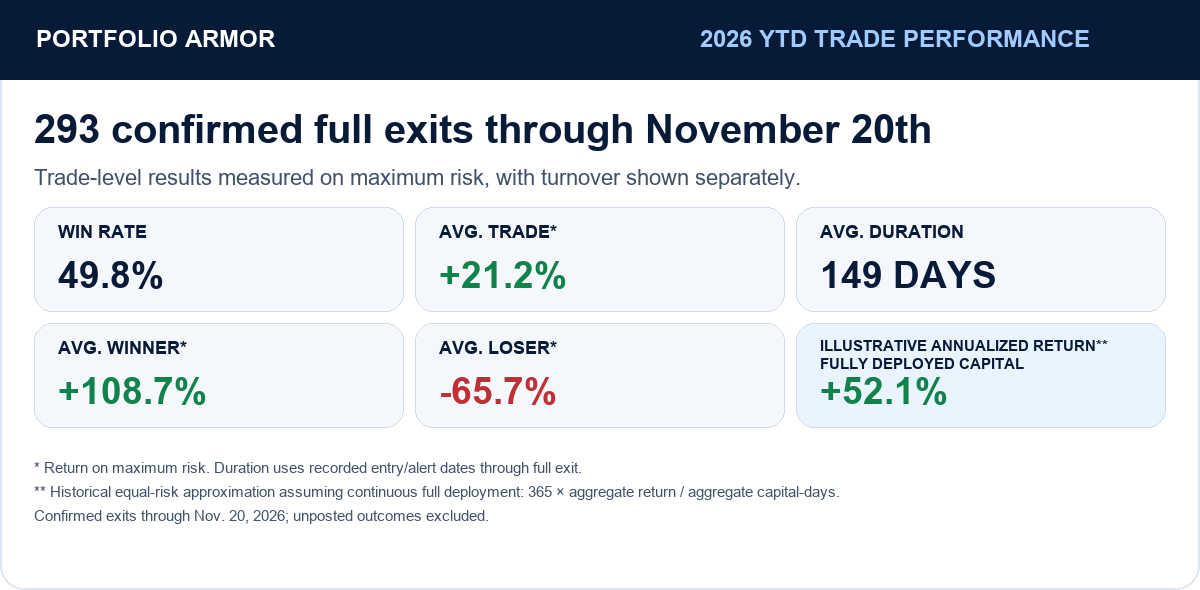
As of Friday’s close, we’d fully exited 293 trades this year, with an average return of 21.2% on original maximum risk.

What We’re Watching Next
Friday’s selloff and spike in volatility had some hallmarks of capitulation. Some investors took it as a sign that stocks were near a bottom.
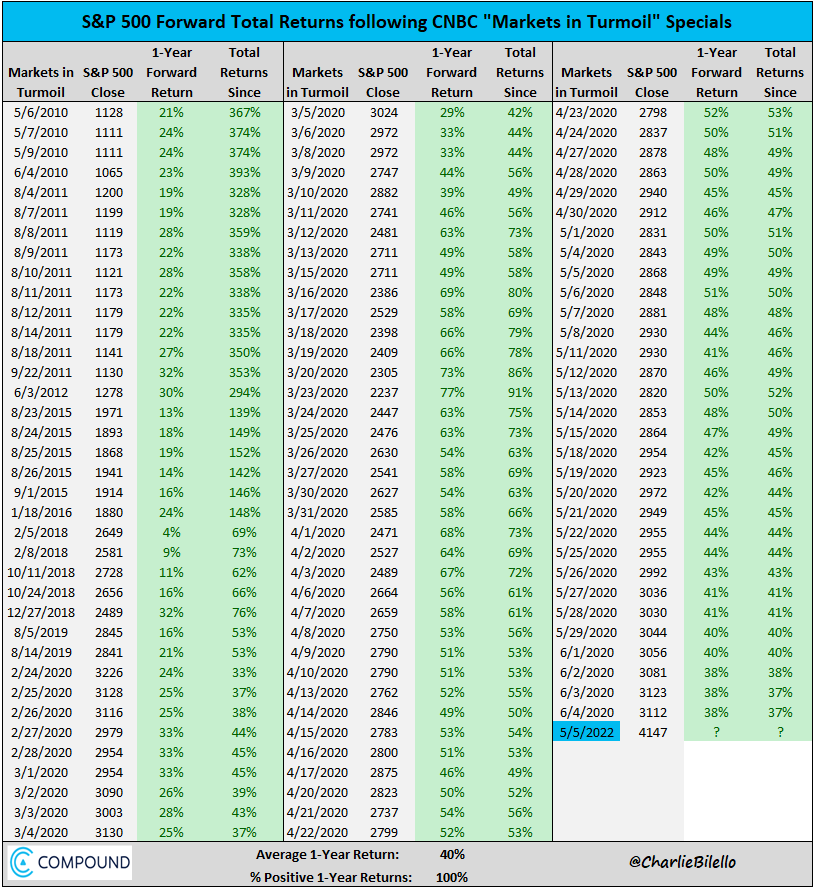
An old CNBC “Markets in Turmoil” promo was back on X on Friday. The promo came from CNBC’s May 5, 2022 special. Aria Radnia called it a bottom signal, pointing to a table of what happened after past broadcasts.


Charlie Bilello’s table shows the S&P 500’s total return over the year after each special. Many of those dates fell during the same 2020 selloff and rebound.
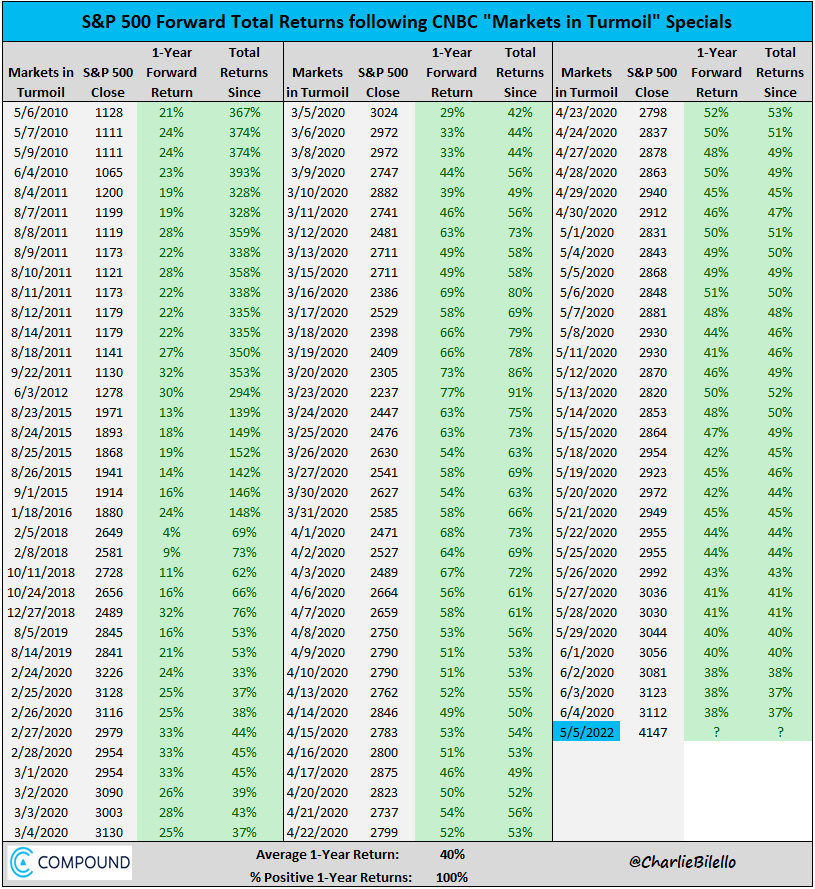
The S&P 500 fell another 13.7% between the May 2022 broadcast and its October closing low. Bilello’s follow-up put its total return at +1.5% a year after the broadcast. An investor who bought on the day of the special and held for a year saw a double-digit drawdown along the way.
We’ll consider bullish entries in beaten-down businesses we like once our technical screens show buyers returning and the individual stock looks like it may have bottomed. Recent results still have to support the case for buying it.
We’re looking for bearish trades in defensive stocks that got overbought and expensive during the rotation and are starting to weaken. A rebound could draw investors back into momentum names. If the selloff deepens, some investors may sell defensive holdings to raise cash.
If this week has you thinking about hedging, our iPhone app finds optimal puts and collars for stocks and ETFs.

Get the full details of our asymmetric options trades before we enter them.
New to our alerts? Our Start Here post explains how we find and structure trades.