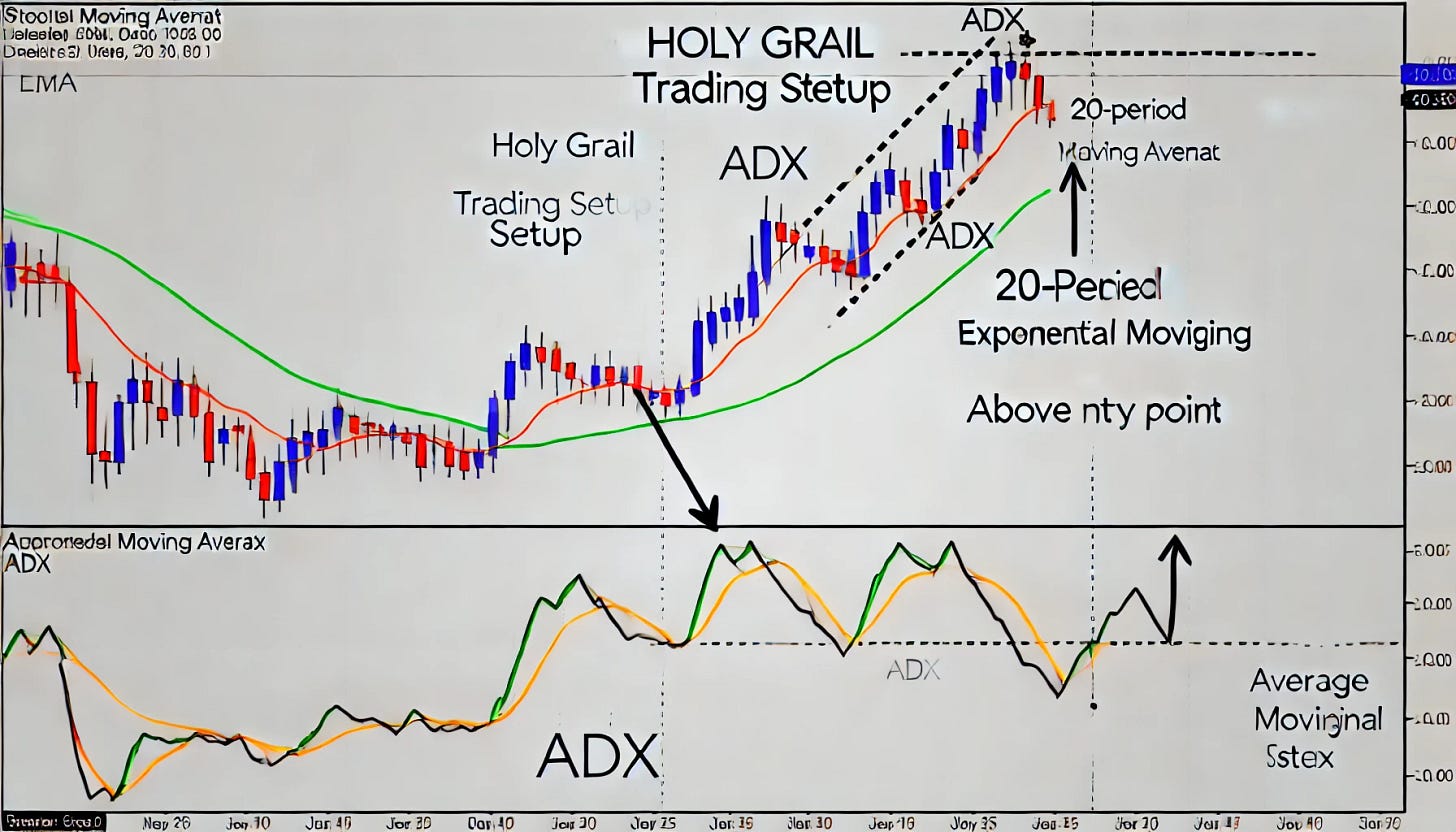
Trade Alert: Holy Grail
Our system's #1 name as of Tuesday's close also exhibits the "Holy Grail" technical set up.
ChatGPT4o/DALL-E still misspells some words in images, but we’ll roll with this one.
Our System’s Top Name
As regular readers know (but new ones might not), each day the market is open, the Portfolio Armor website ranks every security with options traded on it in the U.S. by its estimate of their expected returns over the next six months. Since I started this Substack in December of 2022, the top ten names on that ranking have averaged returns of 19.49% over the next six months, while SPY 0.00%↑ has averaged 6-month returns of 12.58% over the same period.
So I am always curious to see which names hit that top ten each night. On Tuesday night, I looked at the top ten, as usual, and then I went through my Market Watchers list on X to see what some of the top traders and investors I follow were talking about. One of them was talking about a “Holy Grail” technical set-up. As it happened, the stock he saw in the Holy Grail set-up was our #1 name on Tuesday.
The Holy Grail Set-Up
These are the components of a Holy Grail set up:
ADX Indicator (Average Directional Index):
The ADX measures the strength of a trend, not its direction.
A high ADX value (typically above 30 or 25) indicates a strong trend, whether bullish or bearish.
The key is to only look for trades when the ADX shows a strong trend.
Exponential Moving Average (EMA):
Typically, traders use the 20-period EMA to identify pullbacks.
The price must pull back to the 20 EMA while the ADX is indicating a strong trend.
Pullback Entry:
Once the price pulls back to or near the 20 EMA, this is where traders look to enter a position, in the direction of the prevailing trend.
You are not entering when the trend is stretched but during a pause or correction.
Confirmation of Trend Continuation:
Once the price touches the 20 EMA, wait for confirmation, such as a price reversal pattern (e.g., a hammer candlestick) or simply a bounce off the EMA.
Our #1 stock on Tuesday hit these criteria for the Holy Grail:
ADX > 30: Confirms that the market is in a strong uptrend.
Price Pullback to the 20 EMA: As the market pulls back and touches the 20 EMA, it’s not a sign of a reversal but rather a healthy retracement.
Entry Trigger: As the price starts to move back up after touching the 20 EMA, enter a long position, anticipating that the trend will continue.
According to ChatGPT4o:
This setup works because it allows traders to ride strong trends while entering during low-risk pullback periods, rather than chasing the trend when it's already overextended.
Makes sense.
Options prices on this one are a little tricky, so I consulted with our friend David Janello, PhD, CFA of SpreadHunter, who literally wrote the book on these sorts of trades.
He gave us two trade ideas for this one. Details below.
“Holy Grail” Options Trade #1
The stock is Summit Therapeutics (SMMT 0.00%↑), and our first trade on it is a vertical spread expiring on October 18th, buying the $24 strike calls and selling the $25 strike calls, for a net debit of $0.36. The max gain on 10 contracts is $640, the max loss is $360, and the break even is with SMMT at $24.36. This trade filled at $0.36.
“Holy Grail” Options Trade #2
Our second trade is selling the $21 strike puts on SMMT expiring on November 15th for $2.50. The max gain on one contract is $250, the max loss is $1,850 (if SMMT went to $0 before November 15th), and the break even is with SMMT at $18.50. This trade hasn’t filled yet. This trade filled at $2.50 on 9/26/2024.
Exiting These Trades
For the call spread, I’m going to open a GTC order to exit at about $0.95, and I’ll lower that price, if necessary, as we approach expiration. For the short put, I have no plans to exit. If the put gets assigned, I’ll put a trailing stop of 15% to 20% on the stock and hold it.


