



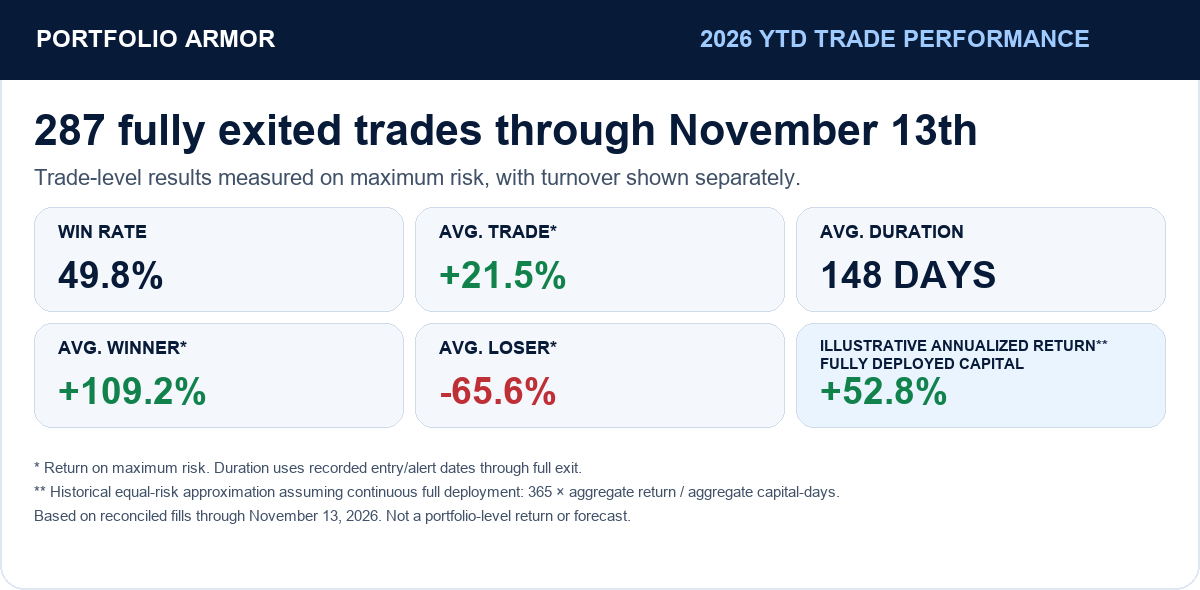
Our Year-To-Date Performance
Our year-to-date trade performance through November 13th appears below.

This Week’s Trade Exits
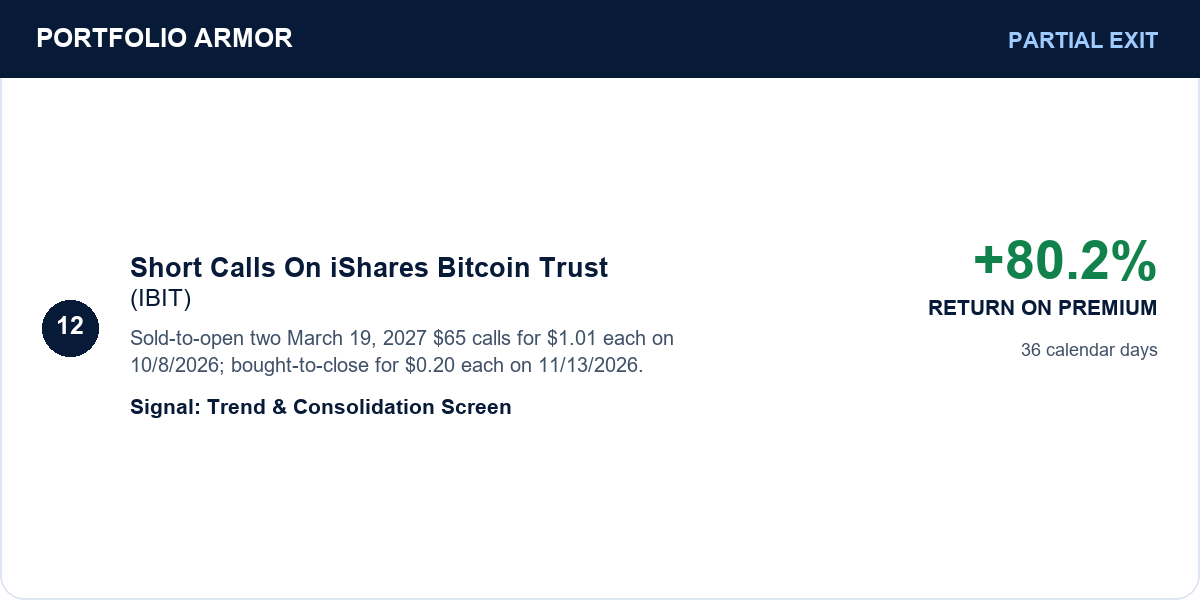
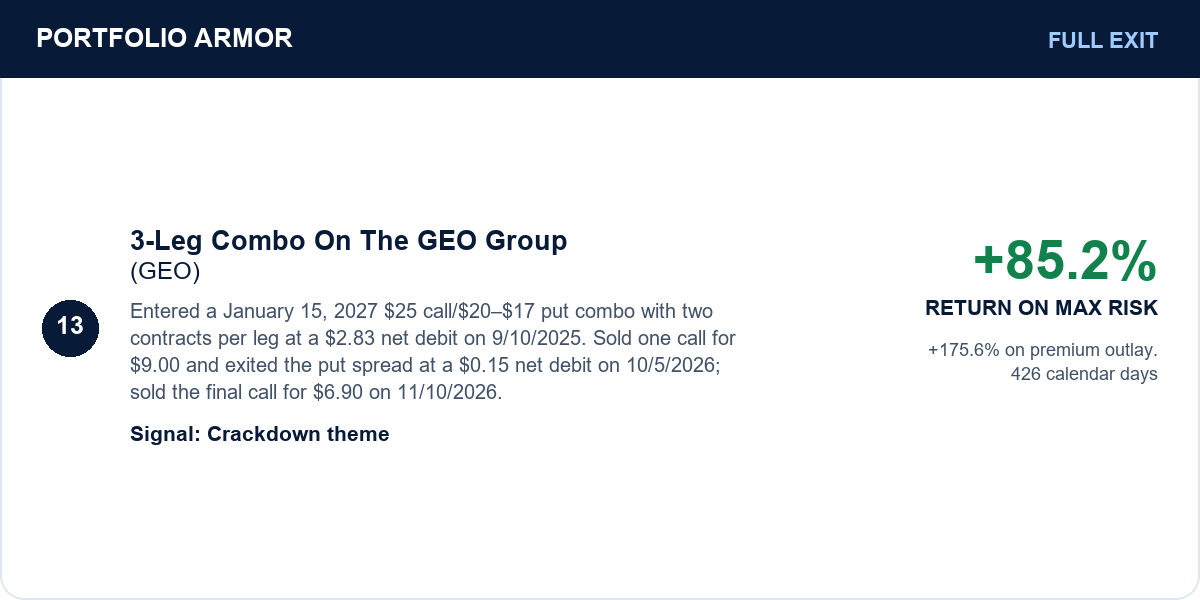
As soon as I exit a trade, I note that in the comments of the post where I first mentioned the trade; at the end of the week, I try to track them all in one post. Starting in July, 2024, I have also been tracking them in a spreadsheet. These are the trades I exited this week.
Each exit card links to its original trade alert.
Stocks or Exchange Traded Products


Options


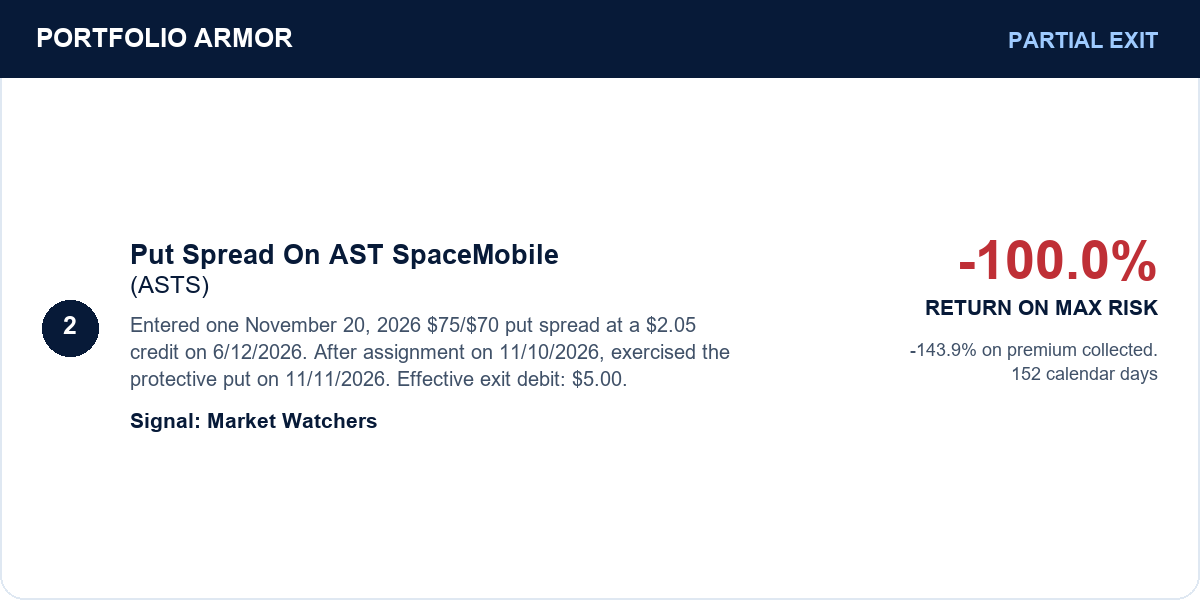

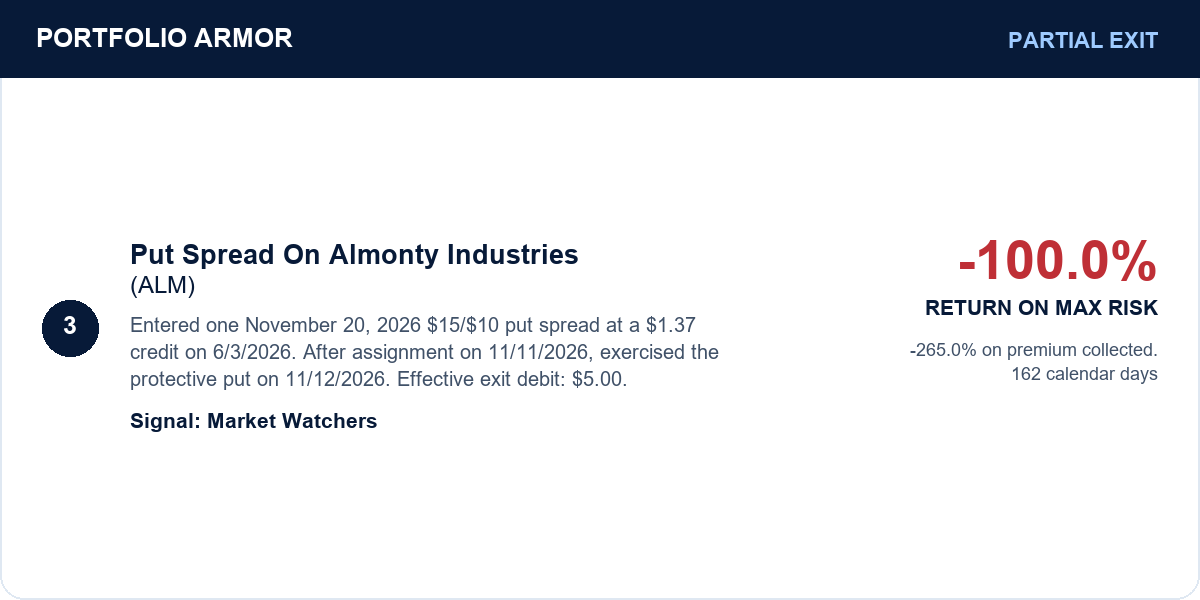

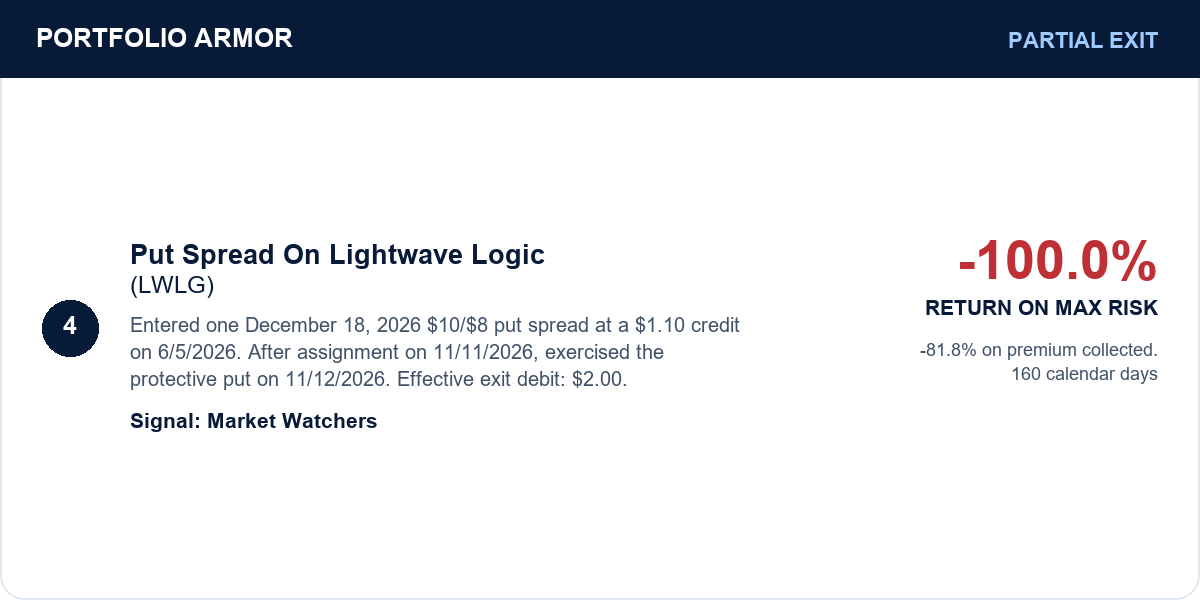

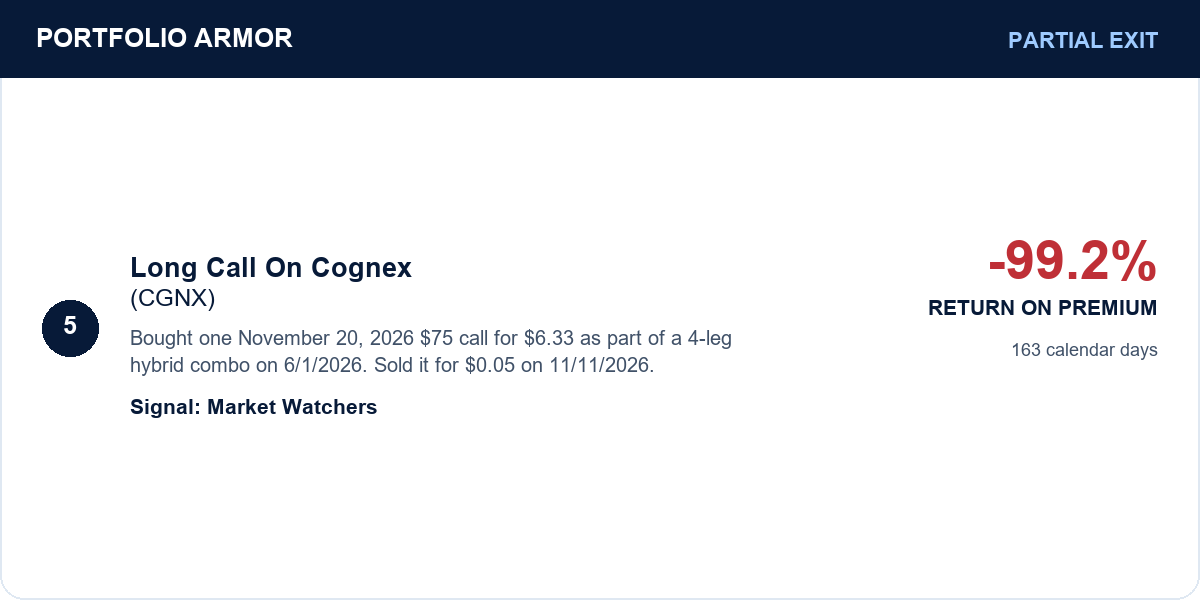









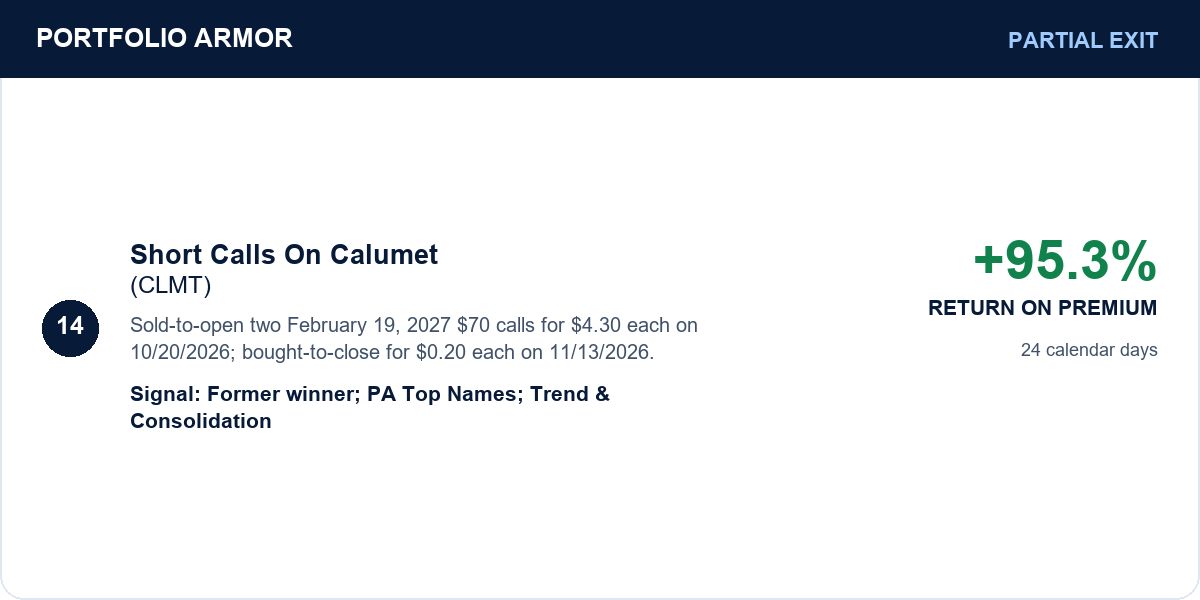

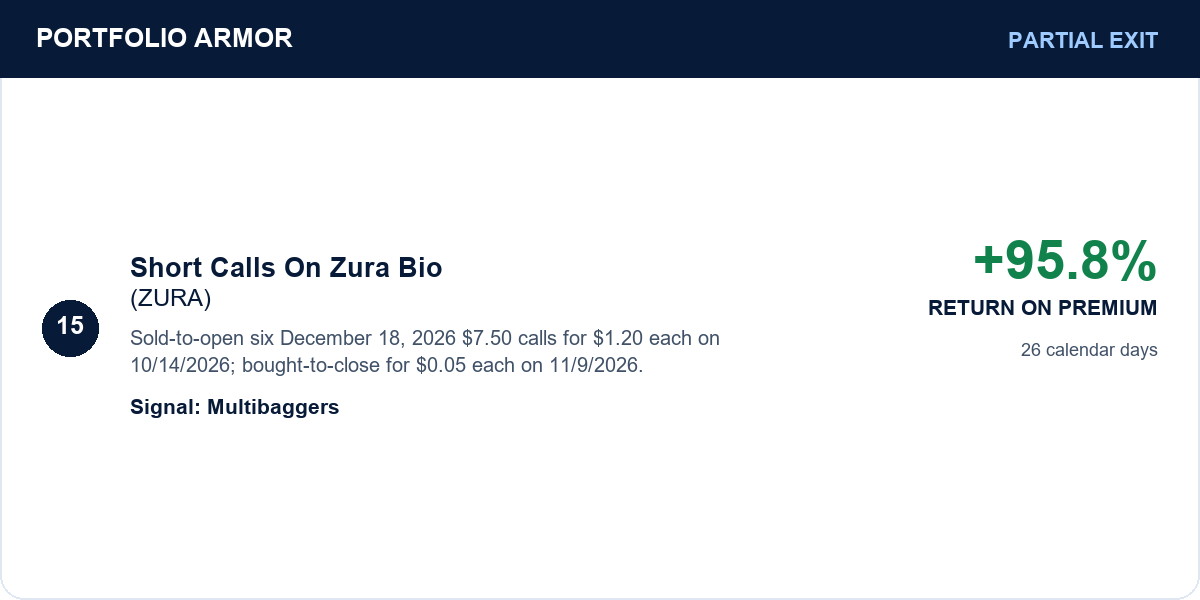

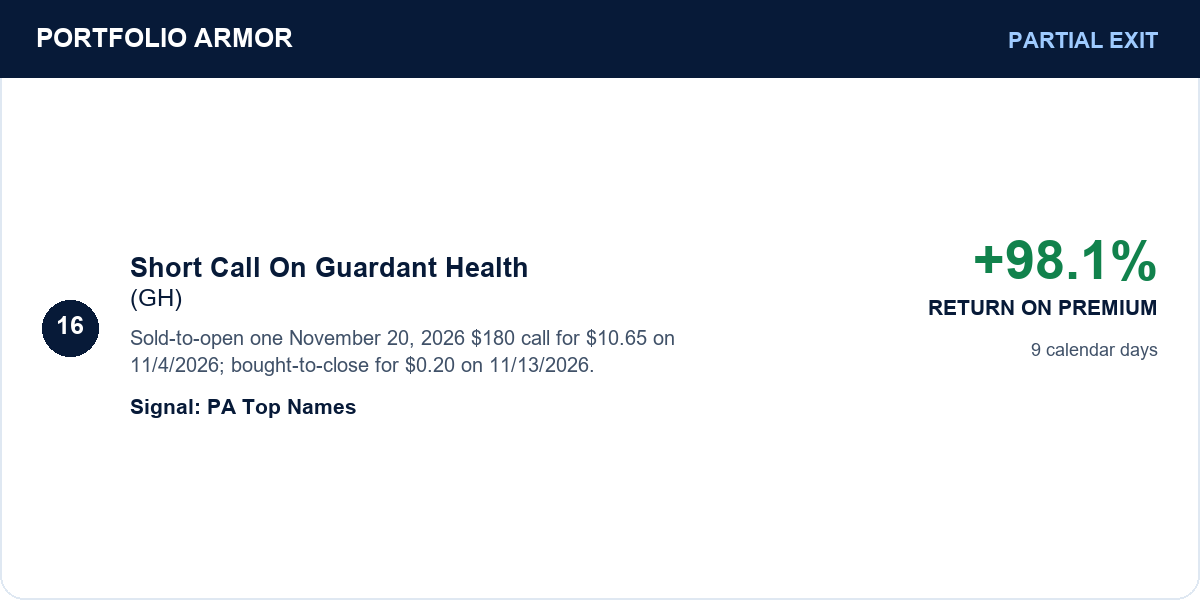

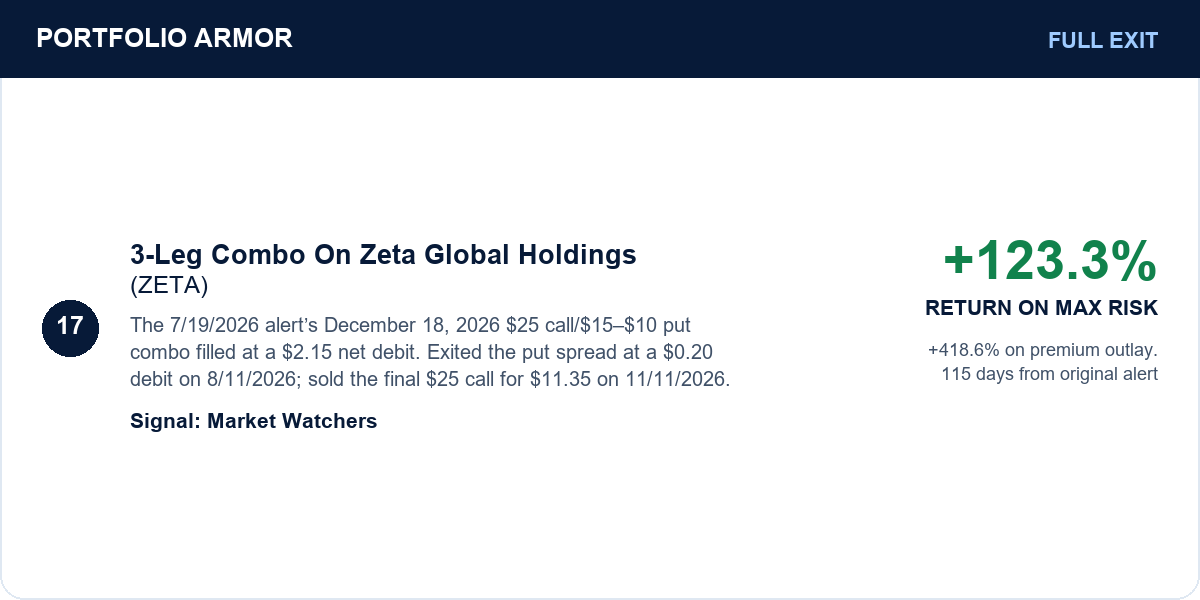
Comments
Stocks and exchange-traded products
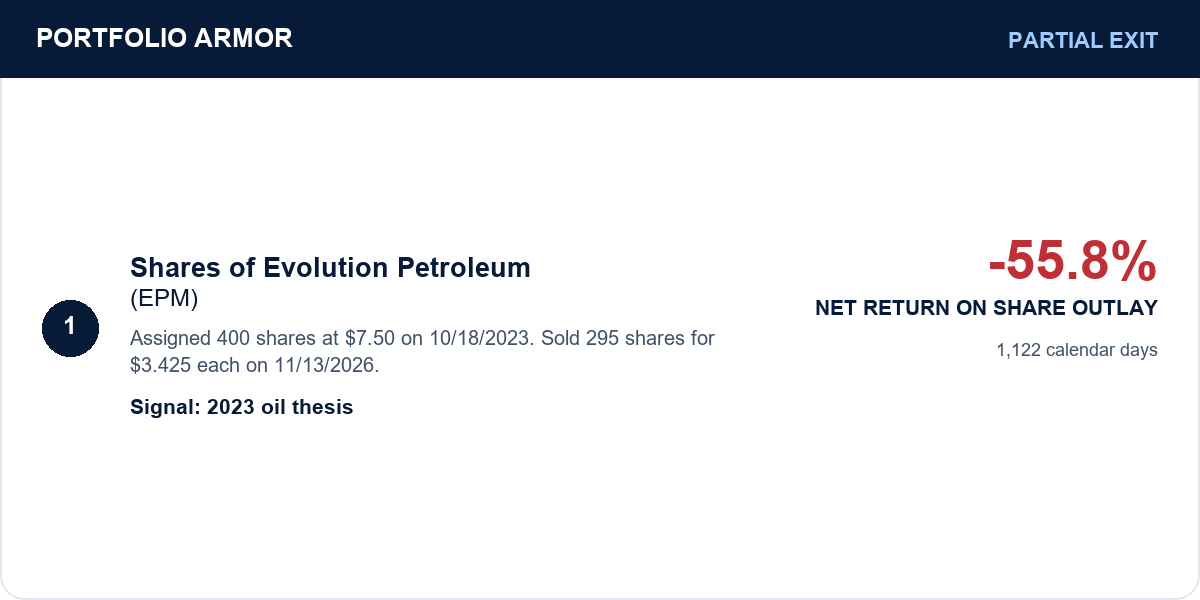
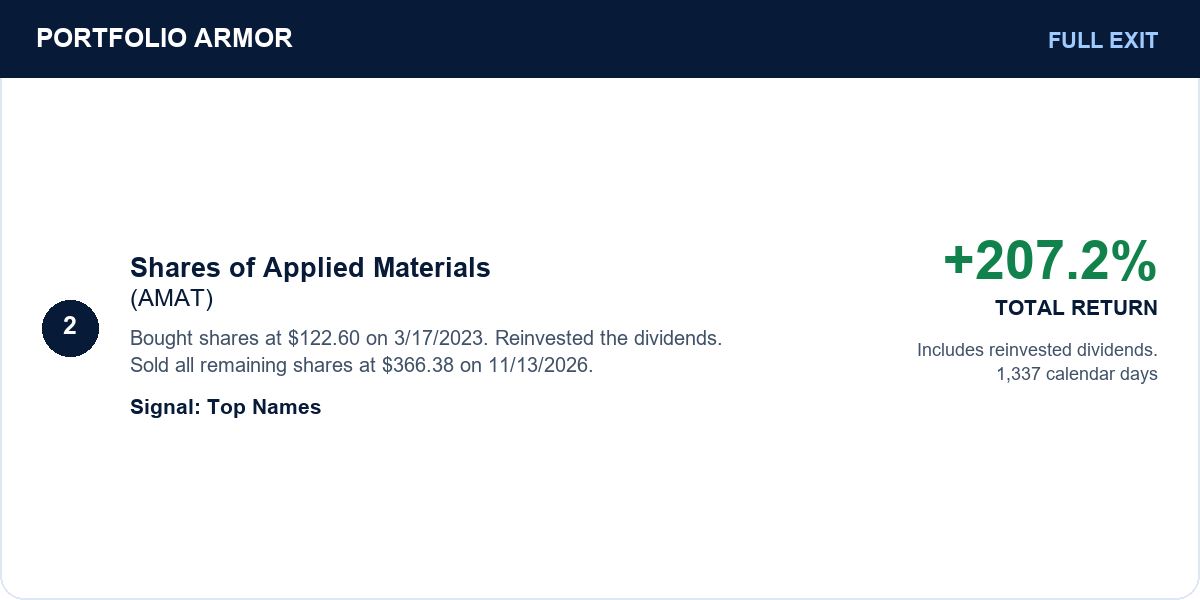
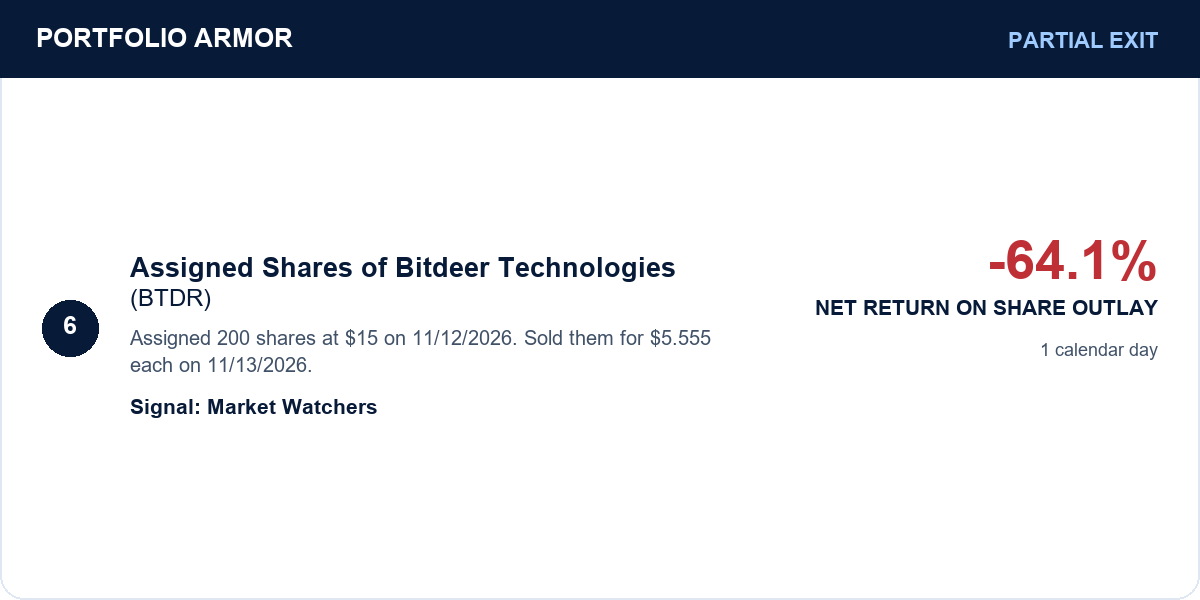
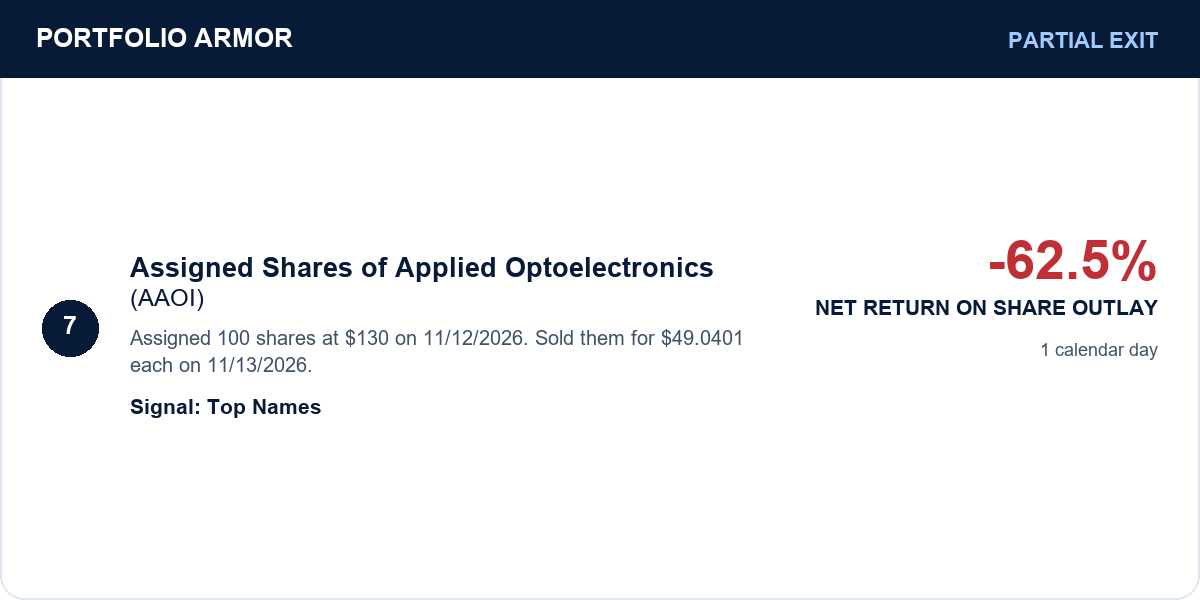
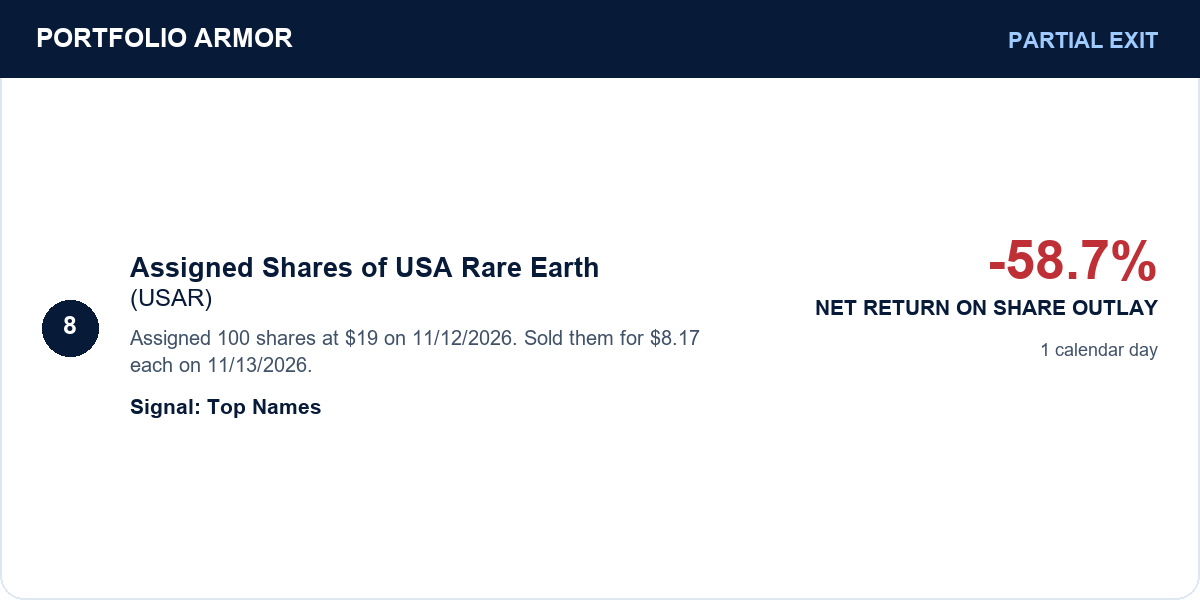
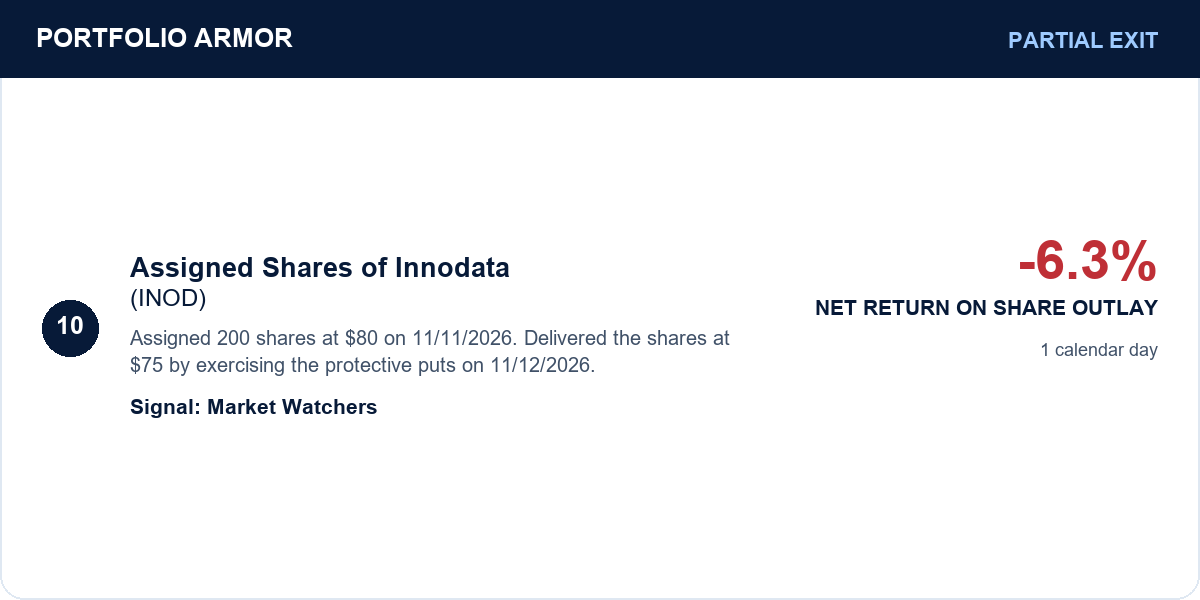
I had a couple of rare stock sales this week: a few short put options were assigned by Fidelity overnight Thursday/early AM Friday, and apparently I didn’t call them to exercise the long puts soon enough so Fidelity sold the assigned shares and shares of a few other positions. The stock I sold for a 200% gain, Applied Materials (AMAT 0.00%↑), was one of our Top Names at the time when we bought it. As you can see below, our Top Names performance has remained strong.

Options
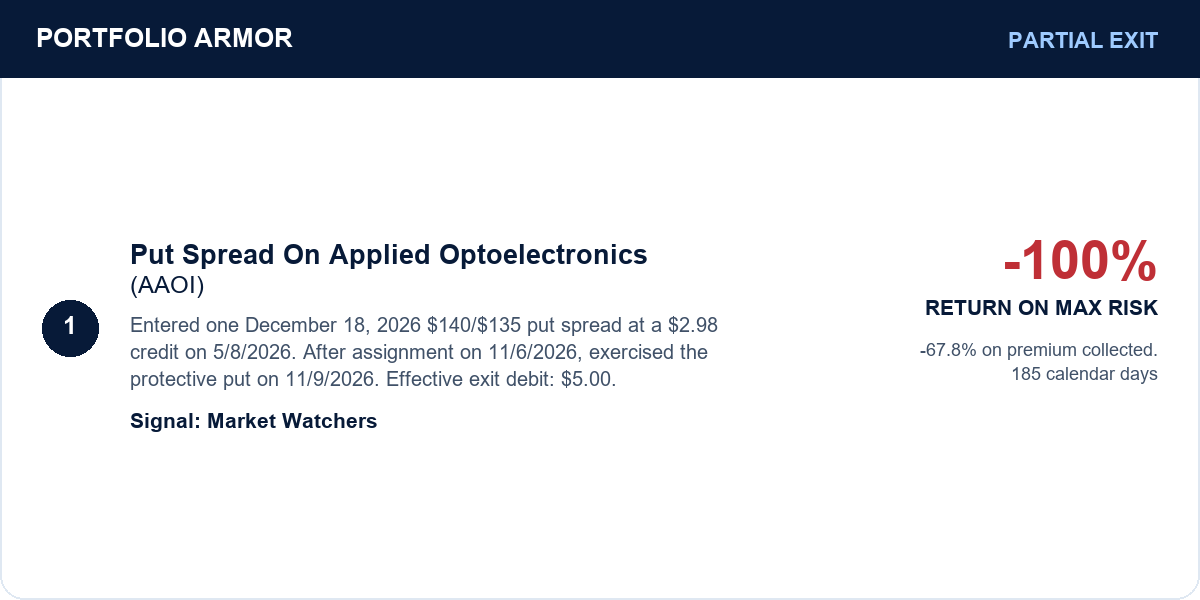
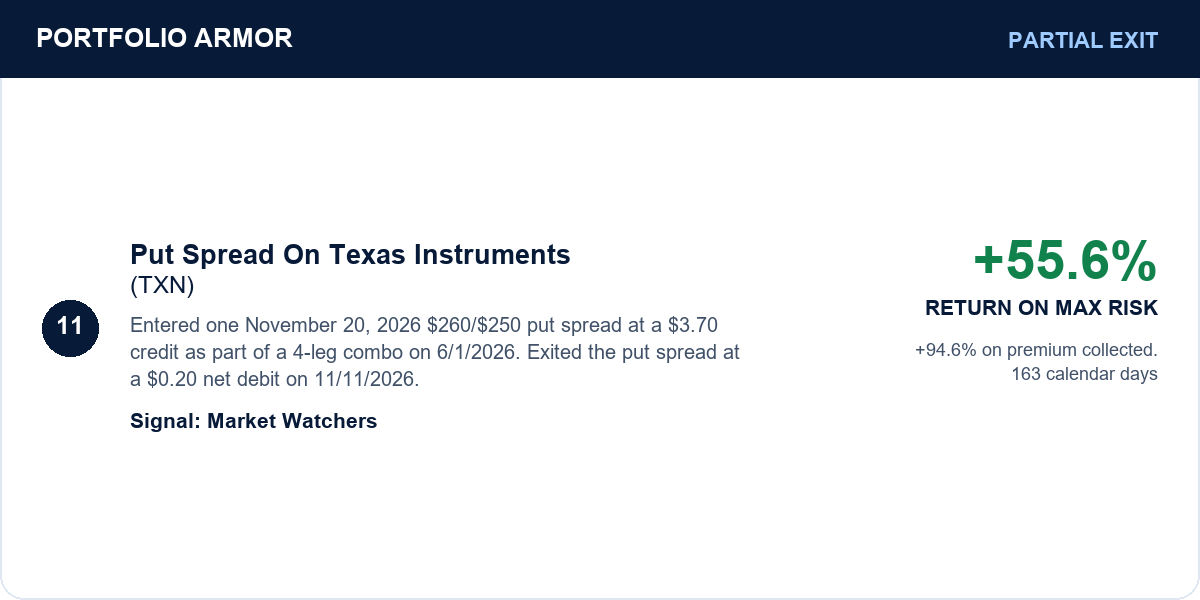
Three of our exits were of shares from short puts that were assigned by Fidelity before I had a chance to exercise the corresponding long puts that comprised the other half of the respective put spreads. Since those puts don’t expire soon, I’m using limit orders to sell them for their intrinsic values plus a little extra to cover Fidelity’s fees.
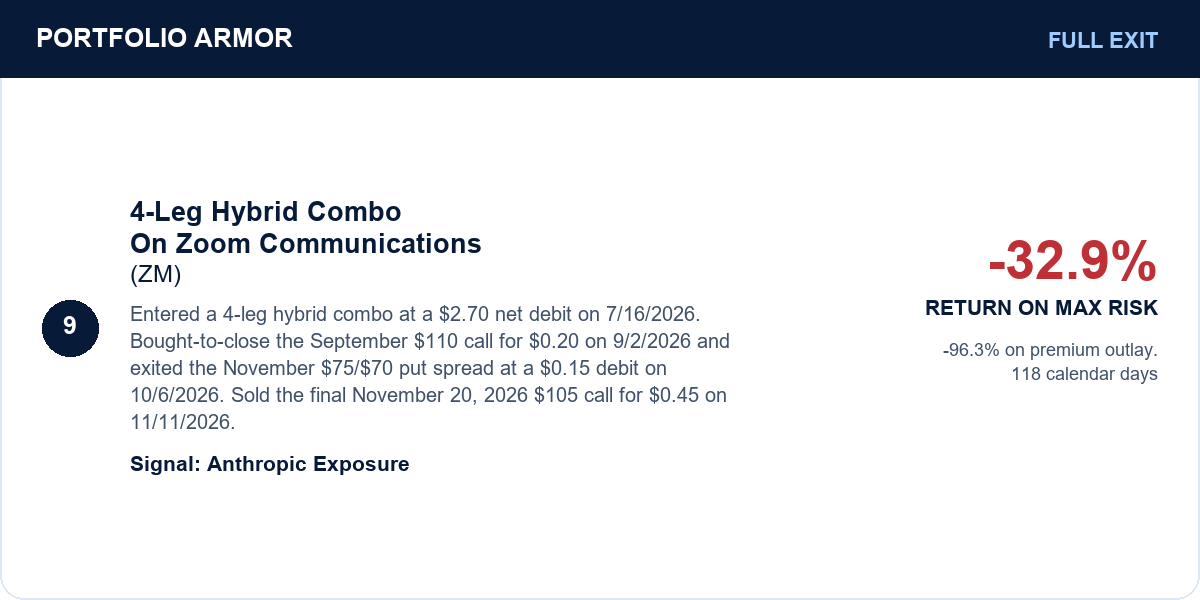
Our full put spread losses were from trades entered near the momentum market peak in late May/early June.
Some of the stocks we traded near what proved to be the momentum peak are now reporting strong quarterly results. We’re using our Early Recovery screen to flag likely bottoms in those names before considering fresh bullish trades.
Notably, our profitable exit in Zeta Global was from a trade we entered in mid-July, after a market selloff. That exemplifies why we’ve continued to put money to work during the current selloff.